Climate change performance of the United Kingdom in comparison with the European Union

2016
Given that the United Kingdom (UK) has decided to leave the European Union (EU), the following examines the development of CO2 Emissions, Ecological Footprint, GDP(ppp-$) and Climate Debt of the UK in comparison with EU.
Between 1860 and 1890 the UK was the world’s largest greenhouse gas emitter and as late as 1966 the UK was still the 4th largest emitter. See this ‘Interactive timeline of the world’s top 20 emitters‘. When it comes to CO2 Emissions from fossil fuels (without bunker fuels) and cement production the UK was the world’s 15th largest emitter in 2014 (preliminary).
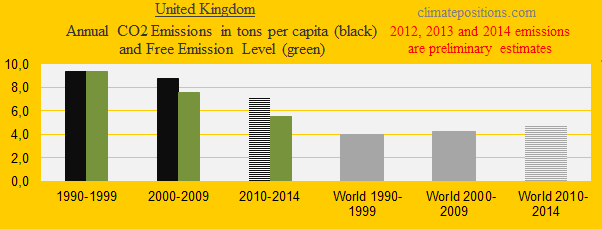
The first diagram (below) shows the per capita CO2 Emissions from fossil fuels (without bunker fuels) and cement production in decades in comparison with the world average. CO2 Emissions since 2012 are preliminary estimates. The green bars are the Contribution Free Level, determined by the level of CO2 Emissions in the 1990s and a number of continuously updated ‘Indicators‘. All years since 1974, the UK emitted 13% or 14% of the total emissions of todays ‘28 EU member states‘ (EU were responsible for 9% of the global CO2 Emissions in 2014). Note that historic CO2 Emissions prior to the millennium is not taken into account (with regard to the exceedance), when calculating the national Climate Debts in ClimatePositions.
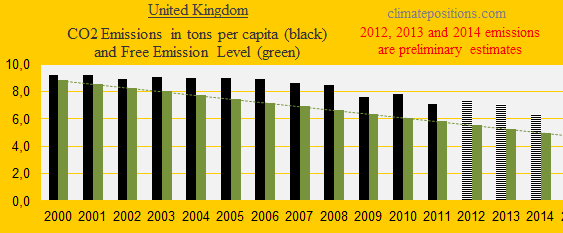
The diagram below shows the per capita CO2 Emissions from fossil fuels (without bunker fuels) and cement production since 2000. CO2 Emissions in 2012, 2013 and 2014 are preliminary estimates. The total CO2 Emissions by 2014 (preliminary) was 24% below the 2006-level, compared to 20% for EU-28.
UK’s renewable electricity production (Btu) as share of the total energy production increased from 2.3% in 2005 to 7.8% in 2012 (49% of the renewable electricity was wind power and 35% was biomass and waste).
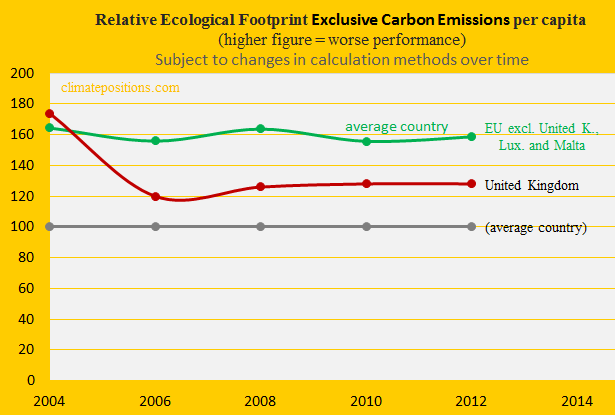
The relative Ecological Footprint (without carbon emissions) per capita of the United Kingdom and an average EU member state excluding UK, Luxembourg and Malta (the two latter due to missing data), with an average world country set at 100, is shown in the diagram below. The per capita footprint of UK is about midway between an average EU member state and the world average.
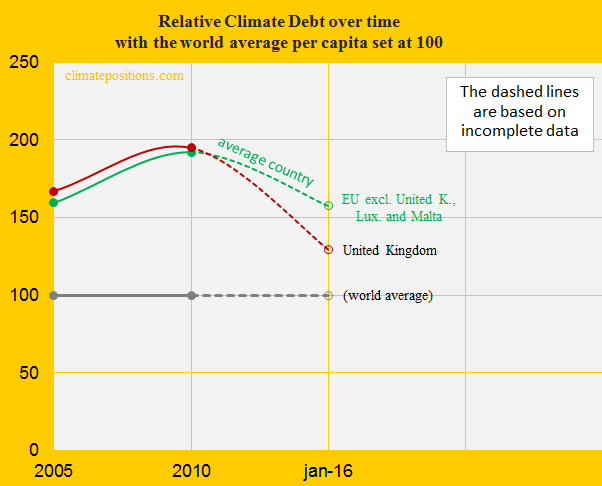
The diagram below shows the per capita Climate Debt since 2005, of UK and an average EU member (excluding UK, Luxembourg and Malta), with the world average set at 100. Since COP15 in Copenhagen in 2009, the UK has performed significantly better than the rest of the EU (on average).
The accumulated total Climate Debt of the UK increased from $47 billion in 2010 to $69 billion by January 2016 (see the ‘Ranking‘). The per capita Climate Debt was $1,068 which ‘Ranked‘ the UK 37th among 148 countries.
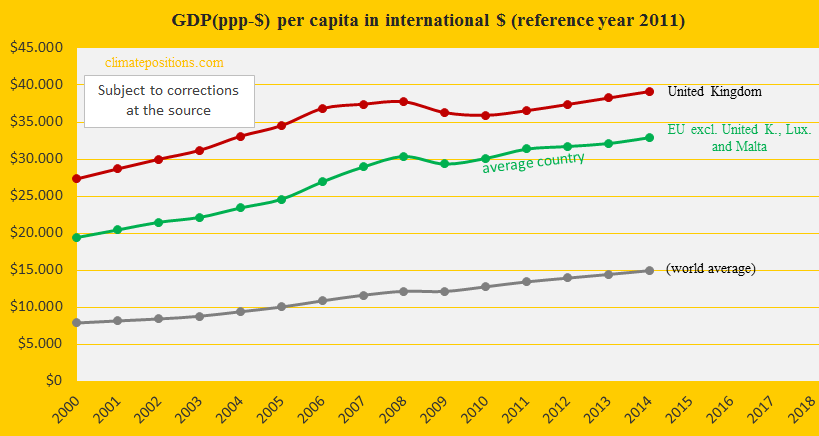
In 2014 the UK was the 22nd wealthiest country among 148 with full data in ClimatePositions. The diagram below shows the development since 2000, in comparison with an average EU member (excluding UK, Luxembourg and Malta) and the world average.
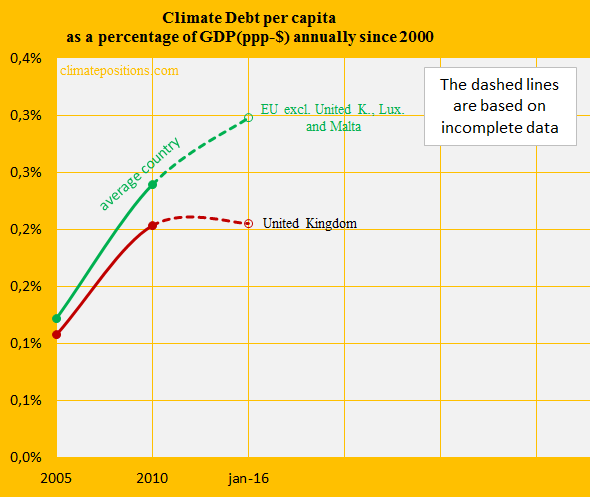
By January 2016 the Climate Debt per capita Climate Debt of the UK, as share of the GDP(ppp-$) annually since 2000, was 0.21%, compared to 0.20% in 2005 (see the ‘Ranking‘). The development since 2005 is shown in the diagram below, along with an average EU member (excluding UK, Luxembourg and Malta). The difference in performance since 2009-2010 is significant.
UK’s climate change financing (deposited) to developing countries is $79 per capita, which is the 3rd largest worldwide (after Norway and Sweden). The updated climate change financing has been deducted to reach the current Climate Debt.
.
Updated data and diagrams of all ‘Indicators‘ and all countries in ClimatePositions are available in the menu ‘Calculations (Excel)’.
Data on carbon emissions (CO2 Emissions) from fossil fuels (without bunkers) and cement production are from Global Carbon Project (CDIAC); (links in the menu “Calculations”).
Data on energy consumption and production is from ‘U.S. Energy Information Administration (EIA)’.
Source on Ecological Footprint: WWF reports “The Living Planet” published 2006-2014 (links in the menu “Calculations”).
Information on national GDP(ppp-$) per capita: Worldbank (links in the menu “Calculations”).
Source on climate change funding (financing) is from Climate Funds Update (links in the menu “Calculations”).
Drawing by Claus Andersen, 2016.
Comments are closed.