Climate change performance: Turkey vs. Egypt
2015
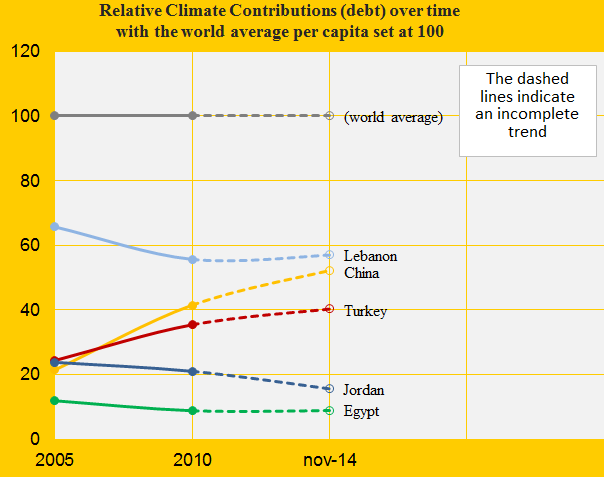
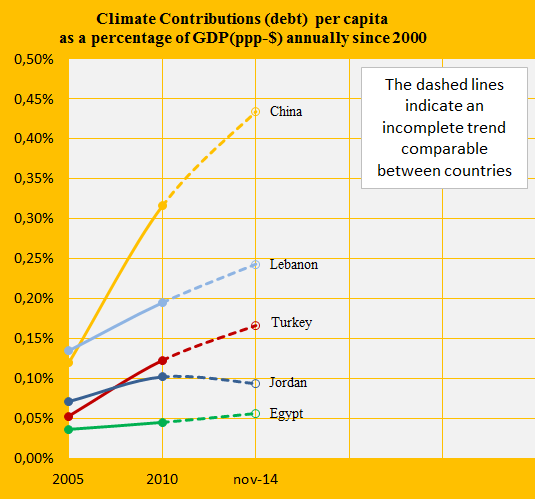
Turkey is ranked 57th and Egypt 71st among 147 countries on the list of the worst performing countries in ClimatePositions. See the ‘ranking’. The Turkish Climate Debt accumulated since 2000 increased from $161 per capita in 2010 to $324 in the latest calculation, while the one of Egypt increased from $40 to $73. The first diagram shows the relative Climate Debt of the two countries in comparison with Lebanon, Jordan and China, with the world average set at 100. Note that the world’s average Climate Debt increased from $455 per capita in 2010 to $769 in 2014 (reflecting the growing CO2 Emissions from fossil fuels and the growing economy). The following examines some indicators and trends of Turkey and Egypt.
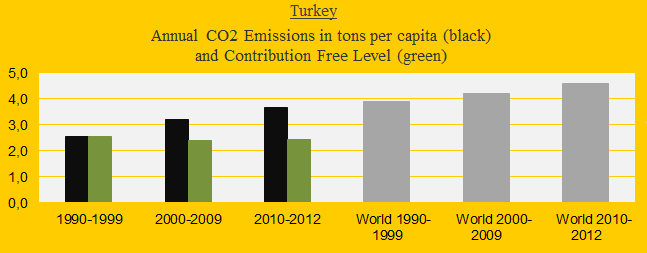
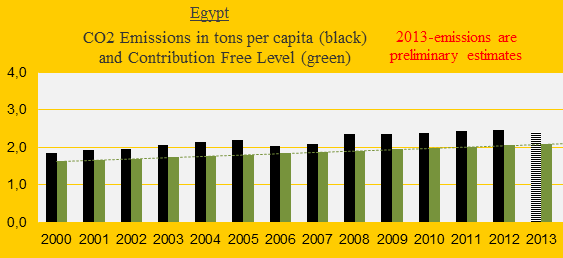
The two diagrams below show Turkey’s and Egypt’s CO2 Emissions from fossil fuels per capita in decades. The green bars show the Contribution Free Level and the grey bars are the world average.
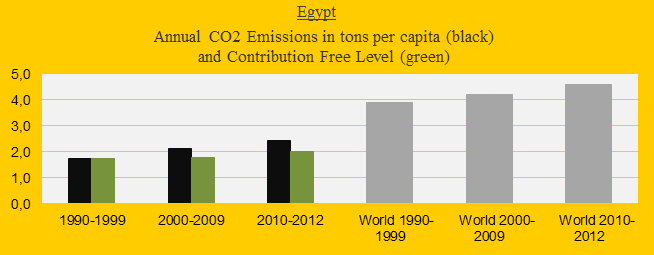
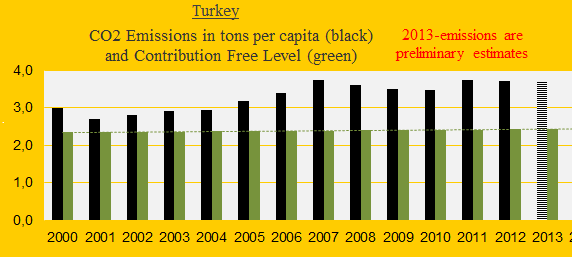
CO2 Emissions per capita annually since 2000 are shown in the diagrams below. The Contribution Free Level (the green bars) of Turkey is continuously around 2.5 tons annually which is close to the level of 1990s. With the current indicator values Egypt can increase emissions by 32% in 2019 compared to the level of 1990s without incurring any Climate Debt.
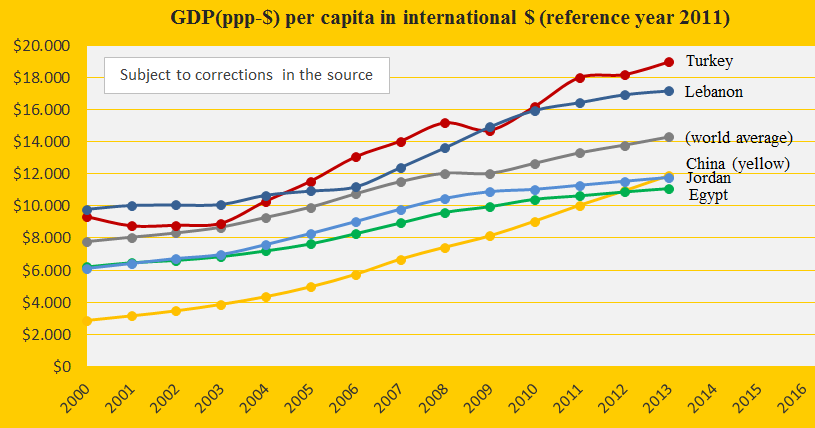
The next diagram shows the GDP(ppp-$) per capita of Turkey, Egypt, Lebanon, Jordan, China and the world average. Since 2003 the Turkish growth rate is even faster than the one of China.
The diagram below shows the accumulated Climate Debt as percentages of the GDP(ppp-$) annually since 2000. The Egyptian performance is clearly better than the Turkish.
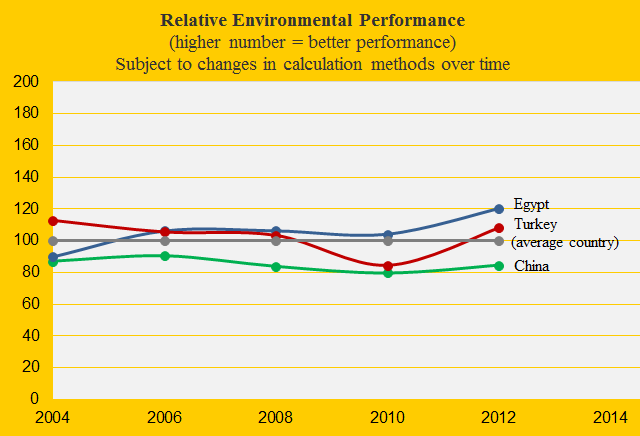
The Environmental Performance is more a domestic matter and poor countries often perform worse than more wealthy countries. However, Egypt performs better than both Turkey and China – an average country is set at 100 in the diagram below. Examine the detailed scores and ranks of ‘Egypt’ and ‘Turkey’.
Updated data and diagrams of all ‘indicators‘ for all countries in ClimatePositions are available in the menu ‘Calculations (Excel)‘.
.
A hypothetical example: If Turkey had remained the level of CO2 Emissions since 1990s (2.5 tons per capita) until today, then the present climate debt would have been $4 Billion instead of $26 Billion (and the ranking would have been 73rd instead of 57th).
Information on national GDP(ppp-$) per capita: Worldbank (links in the menu “Calculations”).
Source on CO2 Emissions: EIA, U.S. Energy Information Administration and data on preliminary national CO2 Emissions are from Global Carbon Project (links in the menu “Calculations”).
Source on Environmental Performance: Yale and Columbia University reports, published 2006-2014 (links in the menu “Calculations”).
Comments are closed.