Climate Debt: Bahrain ranks 12th (immigrant workers reduce per capita CO2 Emissions)
Bahrain’s current Climate Debt, accumulated since 2000, is $3,352 per capita. The ‘Ranking’ by January 2016 was 12th among 148 countries. Although the total Bahraini CO2 Emissions from fossil fuels and cement production have increased about 100% since 1990, and 35% since 2006, the per capita emissions have declined from 27.2 tons in the 1990s to 17.9 tons in 2011 – how can that be?
The key explanation is simple: immigration of great numbers of (often) ‘Slavery-like workers‘, presumably with low individual emissions, has lowered the national average! Today around 55% of Bahrain’s population are immigrants from India, Bangladesh, Pakistan, the Philippines, Indonesia, Jordan, Syria, Yemen, Nepal, East Africa etc. If the immigrant-emissions hypothetically is set at 2 tons of CO2 per capita on average (which is more than their origin countries on average), then the 45% native Bahraini’s emitted 38 tons per capita in 2011, or eight times the world average. Nevertheless, the national ‘COP21 Submission 2015’ mentions no overall emission reduction target. Add to this the nasty facts that Bahrain’s fossil fuel production 2012 (Btu) was 44% above the 2000-level¹ and renewable electricity production (Btu) 2012 amounted only 0.003% of the total energy consumption (Btu). Bahrain is categorized as “authoritarian” and ranks 146 among 160 countries in the ‘Democracy Index 2015‘ … and no data is available on income distribution (inequality) – no surprise.
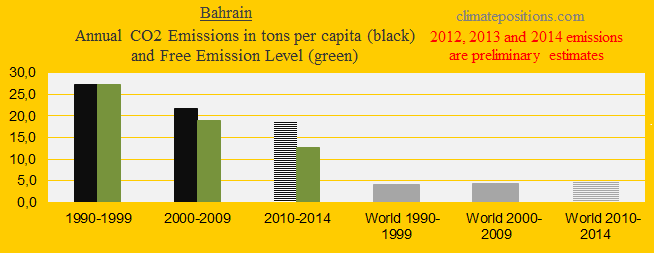
This in mind, the first diagram shows the per capita CO2 Emissions from fossil fuels (without bunker fuels) and cement production in decades in comparison with the world average. CO2 Emissions since 2012 are preliminary estimates. The green bars are the Contribution Free Level, determined by the level of CO2 Emissions in the 1990s and a number of continuously updated ‘Indicators’.
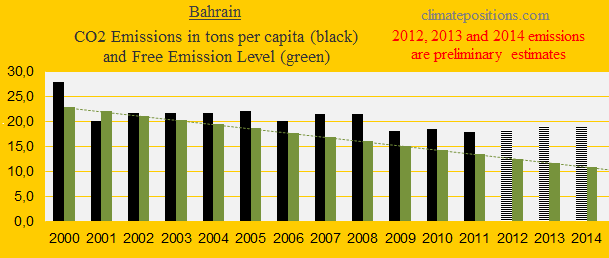
The next diagram shows the per capita CO2 Emissions since 2000. CO2 Emissions in 2012, 2013 and 2014 are preliminary estimates. The 2009-level appears to be sealed.
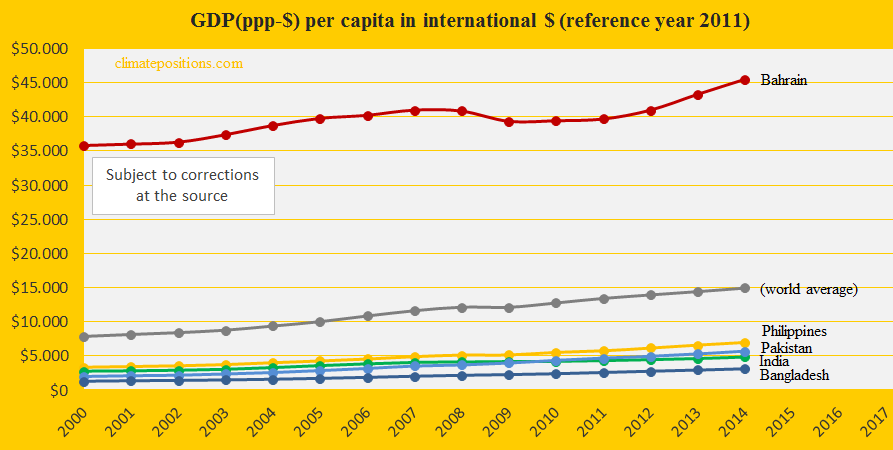
In 2014 Bahrain was the 13th wealthiest country among 148 with full data in ClimatePositions. The diagram below shows the development since 2000, in comparison with the major immigrant countries of India, Pakistan, Bangladesh, the Philippines and the world average.
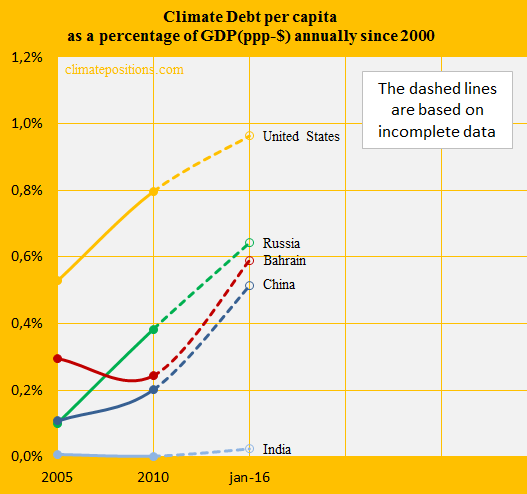
The last diagram shows Bahrain’s Climate Debt as share of GDP(ppp-$) annually since 2000, in comparison with the world’s four largest CO2 emitters China, the United States, India and Russia. The Bahraini increase rate since 2010 is the highest among these countries. See the ‘Ranking‘.
.
¹Bahrain’s production of natural gas increased by 68% between 2006 and 2013. According to a 2015-study in the journal Nature around 61% of all known extractable gas reserves in Middle East (49% globally) and 38% of all known oil reserves (33% globally) will have to stay in ground beyond 2010 if global warming are to be limited to 2°C.
.
Due to massive immigration of workers the little island of Bahrain now has the world’s 3rd highest population density after Singapore and Monaco. Since oil accounts for around 60% of Bahrain’s export receipts and 70% of government revenues the expected fossil free future must be rather unappealing to the authoritarian Islamic Kingdom.
…
Data on carbon emissions (CO2 Emissions) from fossil fuels (without bunkers) and cement production are from Global Carbon Project (CDIAC); (links in the menu “Calculations”).
Information on national GDP(ppp-$) per capita: Worldbank (links in the menu “Calculations”).
Updated data and diagrams of all ‘Indicators‘ and all countries in ClimatePositions are available in the menu ‘Calculations (Excel)‘.
Drawing by Claus Andersen, 2016.
Background information: ‘http://www.migrant-rights.org/2010/12/the-unrecognised-life-of-migrant-workers-in-bahrains-construction-industry/‘, ‘https://en.wikipedia.org/wiki/Demographics_of_Bahrain‘, ‘https://en.wikipedia.org/wiki/Bahrain‘, ‘http://www.migrant-rights.org/2014/06/immigrants-in-bahrain-comments-on-their-labor-and-political-positions/‘, ‘https://dearkitty1.wordpress.com/2012/06/22/bahrain-modern-slave-trade-center/‘.
Comments are closed.