Climate Debt: France ranks 35th among 148 countries

2016
France is responsible for 1.3% of the global Climate Debt of $5.7 trillion, accumulated since 2000. The French per capita Climate Debt by January 2016 was $1,148 which ‘Ranked’ France 35th among 148 countries, compared to 28th in 2010. Different rankings are available in the menu “Climate Debt”. The following examines the CO2 Emissions, Nuclear Power, Environmental Performance, GDP(ppp-$) and Climate Debt of France, in comparison with four countries with significant French-speaking populations: Canada, Belgium, Switzerland and Algeria.
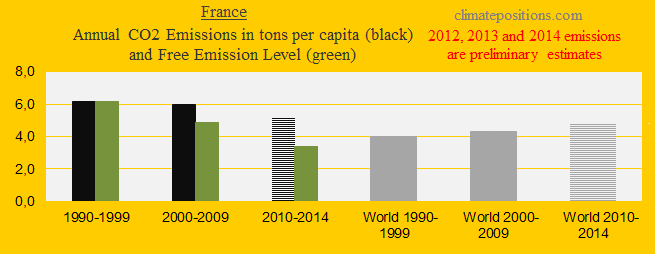
The first diagram shows the French per capita CO2 Emissions from fossil fuels (without bunker fuels) and cement production in decades in comparison with the world average. CO2 Emissions since 2012 are preliminary estimates. From 6.2 tons in the 1990s the level decreased to 5.7 tons on average between 2000 and 2014 (preliminary). The green bars are the Contribution Free Level in ClimatePositions, determined by the level of emissions in the 1990s and a number of continuously updated ‘Indicators’.
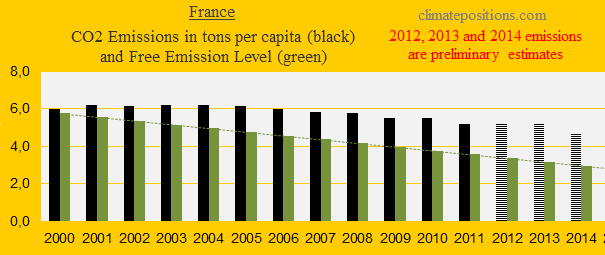
The diagram below shows the per capita CO2 Emissions from fossil fuels (without bunker fuels) and cement production since 2000. Emissions in 2012, 2013 and 2014 are preliminary estimates. The total French CO2 Emissions 2014 (preliminary) was 21% below the 2005-level.
In 2016 France set long-term targets to reduce greenhouse gas emissions by 40% by 2030 compared with 1990 levels, and by 75% by 2050 (‘Source‘).
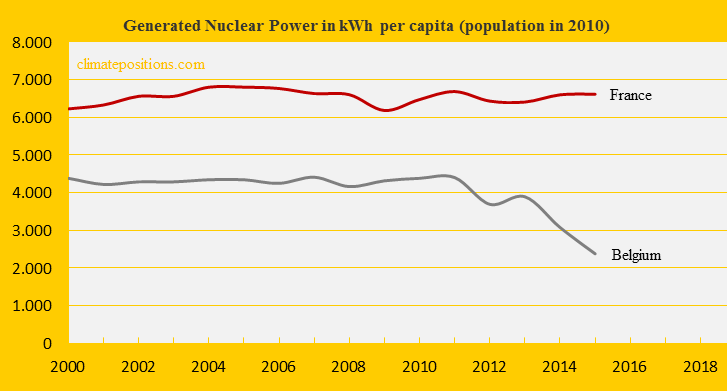
France is the world’s 2nd largest Nuclear Power generator (after the United States) and the largest per capita generator (passed Sweden in 2015). The diagram below shows the per capita generation since 2000, in comparison with neighboring Belgium.
According to ‘World Nuclear Association’ Nuclear Energy supplies 75% of the French electricity (in 2014 the National Assembly set a target of 50% by 2025). For comparison, renewable electricity supplied 20% of the total electricity generation in 2012, or 16% of the total primary energy production (Btu). Note that the convenient hydroelectricity supplied 70% of the renewable electricity in 2012 (the National Assembly also set at target of 32% renewable energy of total energy consumption by 2030).
In ClimatePositions Nuclear Power generation must be reduced at the same rate as CO2 Emissions from fossil fuels and cement production, because dangerous radioactive nuclear waste is left to deal with for hundreds of future generations.
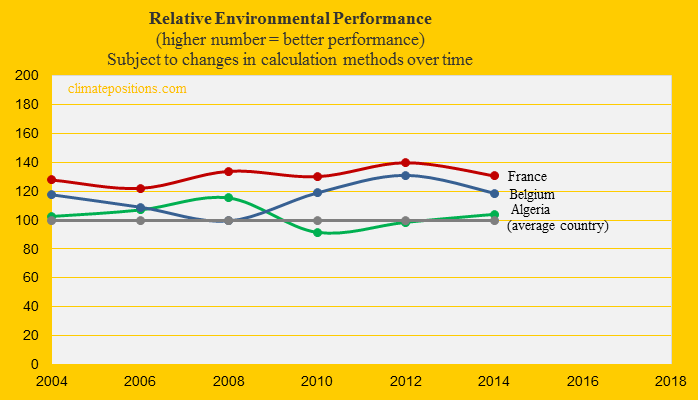
The relative Environmental Performance over time of France, Belgium and Algeria, with the world’s average set at 100, is shown below. The ‘Environmental Performance Index’ published January 2016 (data-year is set at 2014 in the diagram) ranks France 10th among 180 countries. See ‘Details on the French performance’. The previous Index published in 2014 ranked France 27th.
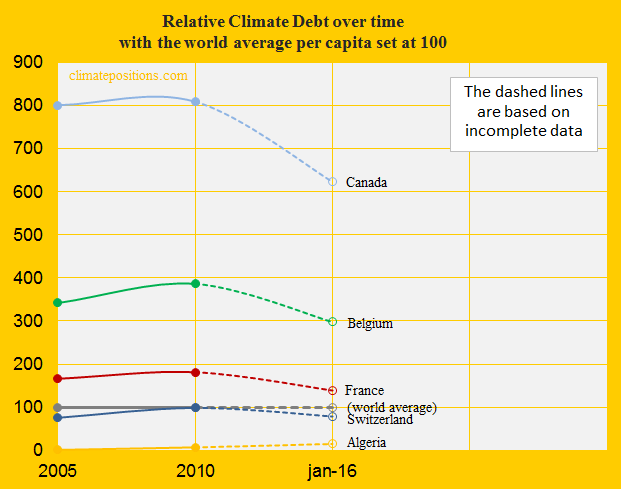
The next diagram shows the relative per capita Climate Debt since 2005 of France, Canada, Belgium, Switzerland and Algeria, with the world average set at 100. In real money the accumulated total French Climate Debt increased from $44 billion in 2010 to $76 billion by January 2016 (see the ‘Ranking’).
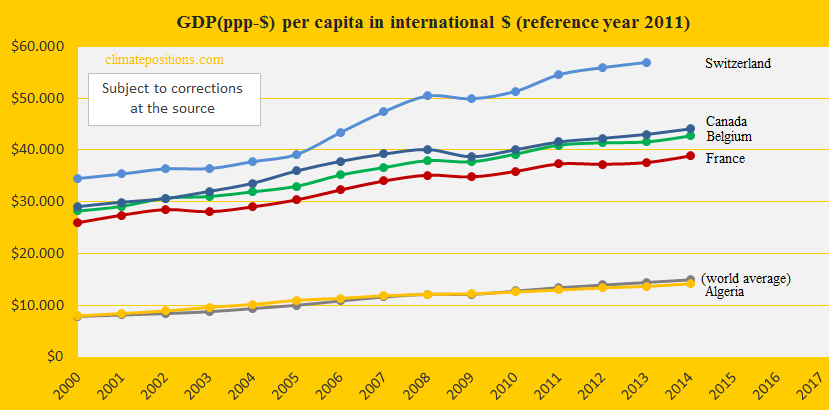
The diagram below shows the development of GDP(ppp-$) since 2000, of the same group of countries and world average.
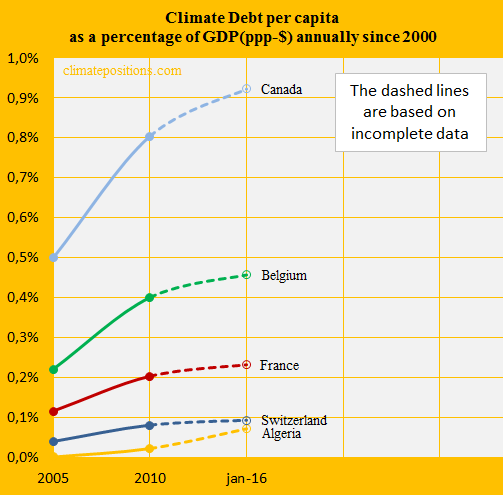
By January 2016 the French Climate Debt as share of the GDP(ppp-$), annually since 2000, was 0.23% and the ‘Ranking’ was 47th; in 2010 the ranking was 43rd. The performance since 2005 is shown in the diagram along the same countries.
.
A hypothetical example: Had France reduced Nuclear Power generation since 2005 at the same rate as CO2 Emissions, then the Climate Debt would have been reduced by $5 billion (7% reduction).
.
Updated data and diagrams of all ‘Indicators‘ and all countries in ClimatePositions are available in the menu ‘Calculations (Excel)‘.
Data on carbon emissions (CO2 Emissions) from fossil fuels (without bunkers) and cement production are from Global Carbon Project (CDIAC); (links in the menu “Calculations”).
Source on Environmental Performance: Yale and Columbia University reports, published 2006-2016 (links in the menu “Calculations”).
Data on national Nuclear Power generation: World Nuclear Association (links in the menu “Calculations”).
Information on national GDP(ppp-$) per capita: Worldbank (links in the menu “Calculations”).
PowerPoint collage by Claus Andersen, 2016.
Comments are closed.