Climate Debt: Iran ranks 33rd (performance of the twenty most populous Muslim countries)
The twenty most populous countries with more than 85% Muslim majority (here called Muslim-20) represent 16.2% of the global population and 7.3% of the global Climate Debt in ClimatePositions. The average climate performance of the Muslim world is superior to the world average, so to speak. Among Muslim-20 Iran ranks 2nd (33rd among 148 countries) on Climate Debt per capita only surpassed by the climate-change-monster of Saudi Arabia.
The table below ranks Muslim-20 by Population (Wikipedia: ‘Islam by country‘) and the five columns are read as follows: 1) Iran’s share of the population of the 148 countries with full data in ClimatePositions (99.7% of the global population) is 1.11%, 2) the share of the Climate Debt of the 148 countries is 1.74%, 3) the share of the global CO2 Emissions from fossil fuels and cement production is 1.84%, 4) Iran’s per capita Climate Debt is $1,270 and 5) the Climate Debt as share of the national GDP(ppp-$), annually since 2000, amounts to 0.61% (see the ‘Ranking’).
| . | Population | Climate Debt | Share of | Climate Debt | Climate Debt |
| . | Share of | Share of | global CO2 | per capita | as share of |
| . | 148 countries | 148 countries | Emissions | 2015 | GDP annually |
| . | . | . | . | . | |
| Indonesia | 3.63% | 0.54% | 1.77% | $122 | 0.11% |
| Pakistan | 2.64% | 0% | 0.52% | $0 | 0% |
| Bangladesh | 1.94% | 0% | 0.18% | $0 | 0% |
| Egypt | 1.28% | 0.21% | 0.71% | $133 | 0.11% |
| Iran | 1.11% | 1.74% | 1.84% | $1,270 | 0.61% |
| Turkey | 1.08% | 0.58% | 1.00% | $432 | 0.21% |
| Algeria | 0.55% | 0.09% | 0.39% | $124 | 0.07% |
| Iraq | 0.50% | 0.18% | 0.44% | $298 | 0.18% |
| Morocco | 0.48% | 0.01% | 0.18% | $17 | 0.02% |
| Afghanistan | 0.45% | 0% | 0.04% | $0 | 0% |
| Saudi Arabia | 0.44% | 3.93% | 1.68% | $7,237 | 1.24% |
| Uzbekistan | 0.44% | 0.03% | 0.36% | $59 | 0.12% |
| Yemen | 0.37% | 0% | 0.07% | $0 | 0% |
| Niger | 0.27% | 0% | 0.00% | $0 | 0% |
| Mali | 0.24% | 0% | 0.00% | $0 | 0% |
| Senegal | 0.21% | 0% | 0.03% | $0 | 0% |
| Guinea | 0.17% | 0% | 0.01% | $0 | 0% |
| Tunisia | 0.16% | 0.02% | 0.08% | $90 | 0.07% |
| Azerbaijan | 0.14% | 0% | 0.10% | $0 | 0% |
| Tajikistan | 0.12% | 0% | 0.01% | $0 | 0% |
| Muslim-20 | 16.23% | 7.34% | 9.42% | $366 | 0.33% |
| 148 countries | 100% | 100% | 98.66% | $826 | 0.49% |
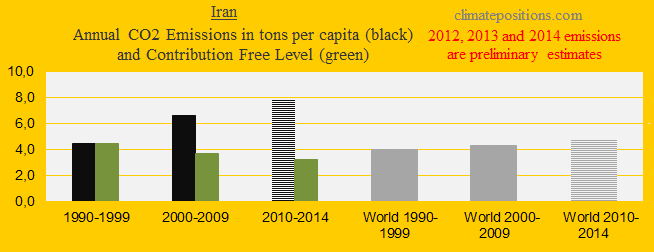
The first diagram shows Iran’s per capita CO2 Emissions from fossil fuels (without bunker fuels) and cement production in decades in comparison with the world average. CO2 Emissions since 2012 are preliminary estimates. From 4.4 tons in the 1990s the level increased to 7.0 tons on average between 2000 and 2014 (preliminary). The green bars are the Climate Debt Free Level in ClimatePositions, determined by the level of emissions in the 1990s and a number of continuously updated ‘Indicators’. Iran was probably the world’s 7th largest CO2 emitter in 2014 (8th largest in 2011).
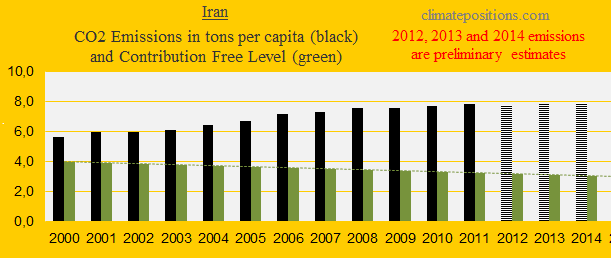
The diagram below shows Iran’s per capita CO2 Emissions from fossil fuels (without bunker fuels) and cement production since 2000. Emissions in 2012, 2013 and 2014 are preliminary estimates.
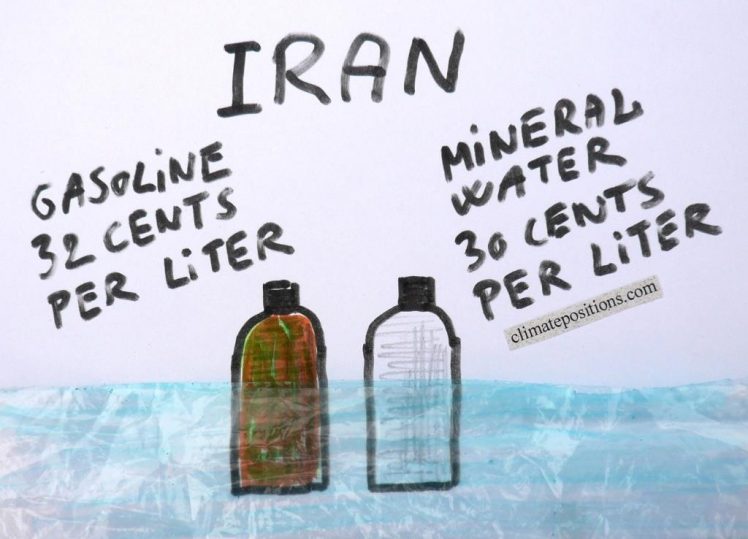
Only 5.2% of the Iranian electricity generation was renewable in 2012 and as little as 0.9% of the total energy production was renewable (Btu). According to ‘Middle East Institute’ (January 2016) natural gas and petroleum supplies around 98% of Iran’s total energy demand and the remaining comes from hydropower, nuclear power, biofuels and other renewable. Fossil fuels for individual consumption are still heavily subsidized and the price of gasoline is nearly the same as for mineral water!
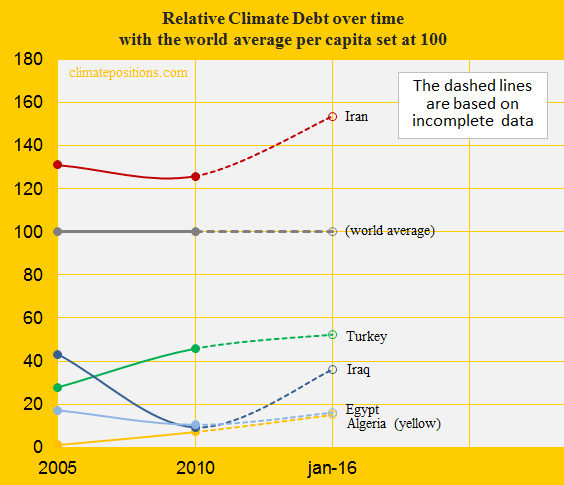
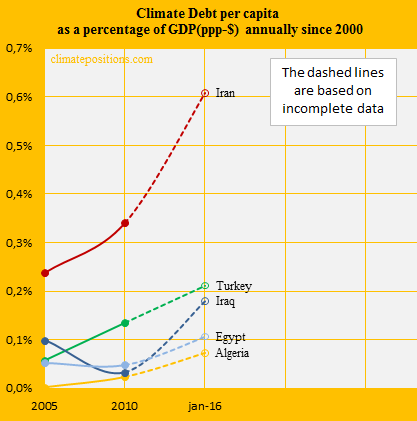
The next diagram shows the per capita Climate Debt since 2005, with the world average set at 100, of Iran, Turkey, Iraq, Egypt and Algeria. In real money the accumulated total Climate Debt of Iran increased from $37 billion in 2010 to $99 billion in January 2016 (see the ‘Ranking’).
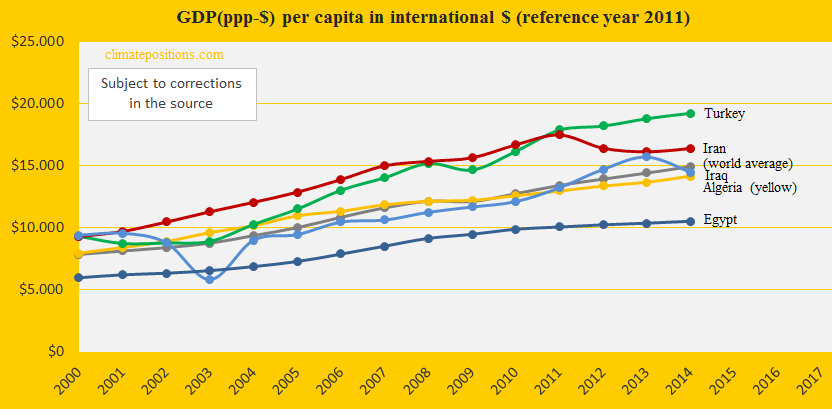
The diagram below shows the development of GDP(ppp-$) since 2000, in comparison with the same four countries and the world average. The ‘UN sanctions‘ from 2006 to January 2016 has been a burden on Iran’s economy.
By January 2016 the Iranian Climate Debt as share of the GDP(ppp-$), annually since 2000, was 0.61% and the ‘Ranking’ was 16th – in 2010 the ranking was 23rd. The poor performance since 2005 is shown in the diagram below along the same group of Muslim countries.
.
A hypothetical example: Had Iran remained at the same level of CO2 Emissions per capita as in the 1990s (4.4 ton), then the total accumulated Climate Debt would have been reduced by $73 billion (74% reduction).
.
Updated data and diagrams of all ‘Indicators‘ and all countries in ClimatePositions are available in the menu ‘Calculations (Excel)‘.
Data on carbon emissions (CO2 Emissions) from fossil fuels (without bunkers) and cement production are from Global Carbon Project (CDIAC); (links in the menu “Calculations”).
Information on national GDP(ppp-$) per capita: Worldbank (links in the menu “Calculations”).
Data on energy consumption and production is from ‘U.S. Energy Information Administration (EIA)’ and ‘Middle East Institute’.
Drawing by Claus Andersen, 2016 (‘Middle East Institute’: “At around 32 cents per liter, the price of gasoline is near that of a bottle of mineral water in Iran”)
Comments are closed.