Climate Debt: Ireland ranks 14th … however, with significant CO2 reductions over the last decade
2016
Ireland’s current Climate Debt is $2,704 per capita and the ‘Ranking’ by January 2016 was 14th among 148 countries. The following examines the Irish climate change performance in comparison with the United Kingdom, France, Canada and the United States.
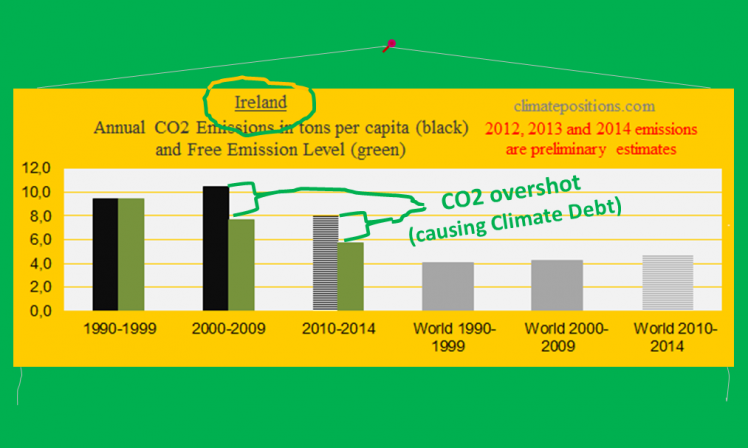
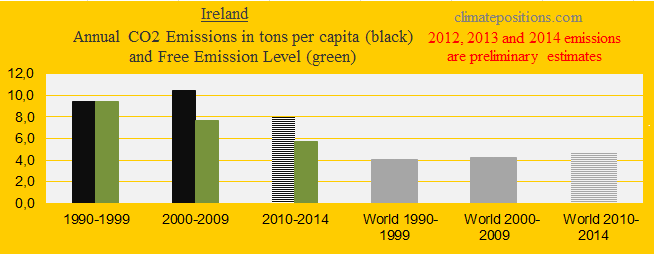
The first diagram shows Ireland’s per capita CO2 Emissions from fossil fuels (without bunker fuels) and cement production in decades in comparison with the world average. CO2 Emissions since 2012 are preliminary estimates. From 9.4 tons emitted in the 1990s the level increased to 10.4 tons on average between 2000 and 2009 – and then dropped to 8.0 tons on average between 2010 and 2014 (preliminary). The green bars are the Contribution Free Level in ClimatePositions, determined by the level of emissions in the 1990s and a number of continuously updated ‘Indicators’.
The gap between the per capita CO2 emissions and the Contribution Free Level (the green bars) is the basis for calculating the Climate Debt in ClimatePositions, as illustrated in the top image. See also this ‘Graphic presentation (pdf)’.
The diagram below shows the per capita CO2 Emissions from fossil fuels (without bunker fuels) and cement production since 2000. Emissions in 2012, 2013 and 2014 are preliminary estimates. The total CO2 Emissions in 2014 (preliminary) was 22% below the 2007-level.
The total Irish energy consumption (Btu) dropped by 16% between 2007 and 2012. The renewable electricity generation (Btu) covered 2.0% of the energy consumption in 2000, 4.0% in 2007 and 8.6% in 2012 (of which 77% was wind power).
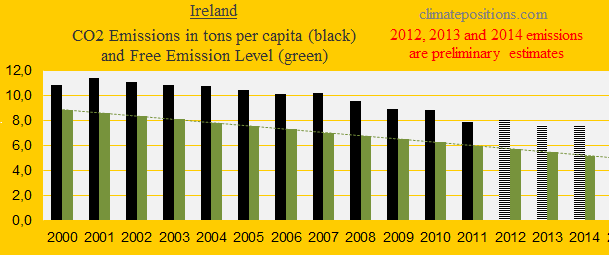
Ireland has an ancient tradition for using ‘Peat’ (or “turf”) for home fires and this energy-source is still widely used in rural areas. Peat is an accumulation of partially decayed vegetation and the peatland-ecosystem is the most efficient carbon sink on the planet (the European Union is attempting to protect these habitats by fining Ireland for digging up peat). Peatland covers around 2% of global land area and it takes thousands of years to develop. Often, peat is the first step in the geological formation of other fossil fuels such as coal. The United Nations Framework Convention on Climate Change (UNFCCC) classifies peat as a “fossil fuel”, whereas the Intergovernmental Panel on Climate Change now classifies peat as “slow-renewable fuel”. Note that regrowth is reported to take place in only 30-40% of the peatlands. The use of peat is not included in the CO2 Emissions in ClimatePositions.
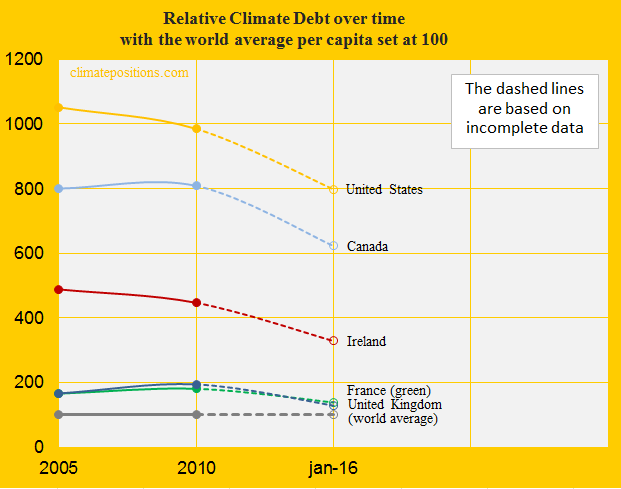
The next diagram shows the per capita Climate Debt since 2005, in comparison with the United Kingdom, France, Canada and the United States, with the world average set at 100. In real money the accumulated total Irish Climate Debt increased from $8.0 billion in 2010 to $12.5 billion by January 2016 (the ‘Ranking’ improved from 34th to 39th among 148 countries).
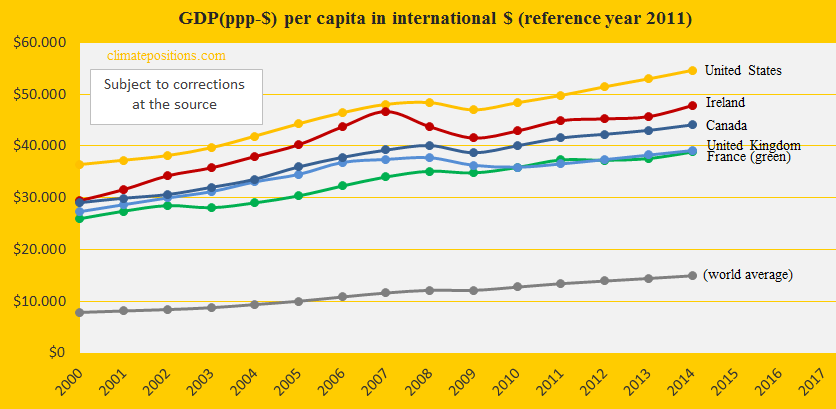
The next diagram shows the development of GDP(ppp-$) since 2000, in comparison with the same four countries and the world average.
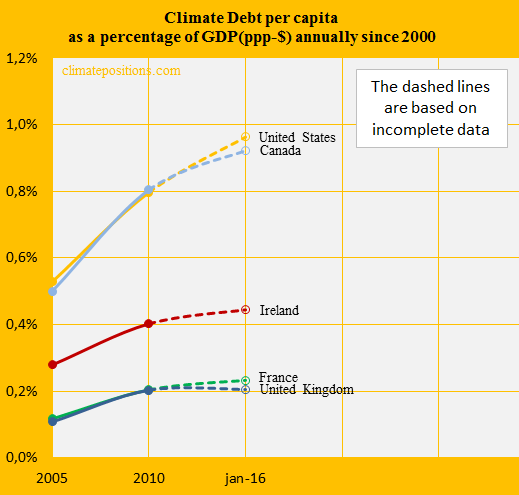
By January 2016 Ireland’s Climate Debt as share of GDP(ppp-$), annually since 2000, was 0.44% and the ‘Ranking’ was 25th – in 2010 the share was 0.40% and the ranking was 15th. The performance since 2005 is shown in the diagram below along the same group of countries.
.
Updated data and diagrams of all ‘Indicators‘ and all countries in ClimatePositions are available in the menu ‘Calculations (Excel)‘.
Data on carbon emissions (CO2 Emissions) from fossil fuels (without bunkers) and cement production are from Global Carbon Project (CDIAC); (links in the menu “Calculations”).
Source on peat is Wikipedia ‘1‘ and ‘2‘.
Information on national GDP(ppp-$) per capita: Worldbank (links in the menu “Calculations”).
PowerPoint diagram is by Claus Andersen, 2016.
Comments are closed.