Climate Debt: Kuwait ranks 2nd … however, soon with “cleaner” fossil fuels!?

The current Kuwaiti Climate Debt, accumulated since 2000, is $26,347 per capita and the ‘Ranking’ is 2nd among 148 countries. However, the extremely wealthy authoritarian oil state plans to generate a “low carbon economy” by creating “refinery alternatives with lower emissions and produce cleaner fuels” … according to a Google translation of the COP21 Submission 2015, written only in Arabic, Kuwait claims to be a developing country and consequently it expects developed countries to pay for its climate change mitigation, technology transfer etc. All this is of course greedy nonsense and inconsistent with the collectively agreed “efforts to limit the temperature increase to 1.5°C.” Seriously, the Kuwaiti problem is this: Around 61% of all known extractable gas reserves in Middle East and 38% of all known oil reserves will have to stay in ground beyond 2010 if global warming is to be limited to 2°C¹. Once a schedule for such a genuine low carbon economy is on track, Kuwait might again become a developing country with reasonable funding wishes. The following examines Kuwait’s CO2 Emissions, Environmental Performance, GDP(ppp-$) and Climate Debt.
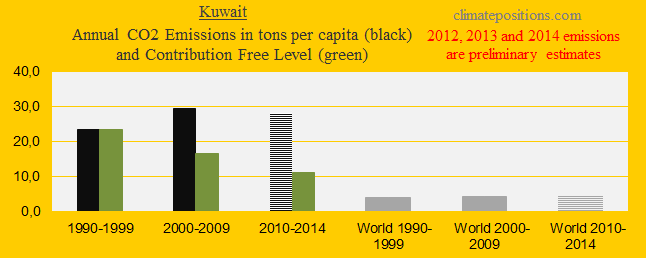
The first diagram (below) shows the per capita CO2 Emissions from fossil fuels (without bunker fuels) and cement production in decades in comparison with the world average. CO2 Emissions since 2012 are preliminary estimates. The green bars are the Contribution Free Level, determined by the level of CO2 Emissions in the 1990s and a number of continuously updated ‘Indicators’.
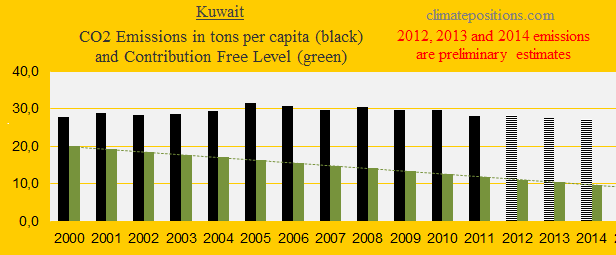
The diagram below shows the per capita CO2 Emissions since 2000. CO2 Emissions in 2012, 2013 and 2014 are preliminary estimates. Kuwait has reduced emissions since 2008, however, way too slowly. Emissions in the 1990s were 23.6 tons per capita on average, whereas emissions since 2000-2014 were 29.1 tons. In 2011 emissions were the 3rd largest in the world (after Qatar and Trinidad and Tobago).
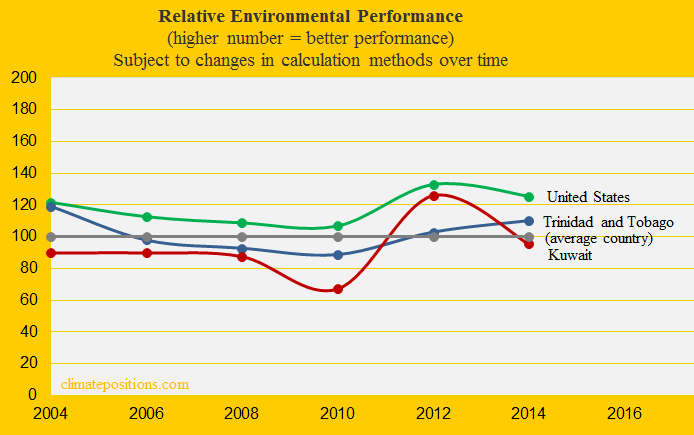
The relative Environmental Performance over time of the Kuwait, United States and Trinidad and Tobago, with the world’s average set at 100, is shown below. The ‘Environmental Performance Index’ published January 2016 (data-year is set at 2014 in the diagram) ranks the Kuwait 113th among 180 countries. See the ‘Details’ on Kuwait’s performance. The previous ‘Index published in 2014’ ranked Kuwait 42nd.
In 2013 the Kuwait was the 3rd wealthiest country among 148 with full data in ClimatePositions. The diagram below shows the development since 2000, in comparison with United States, Saudi Arabia, Oman, Trinidad and Tobago and the world average.

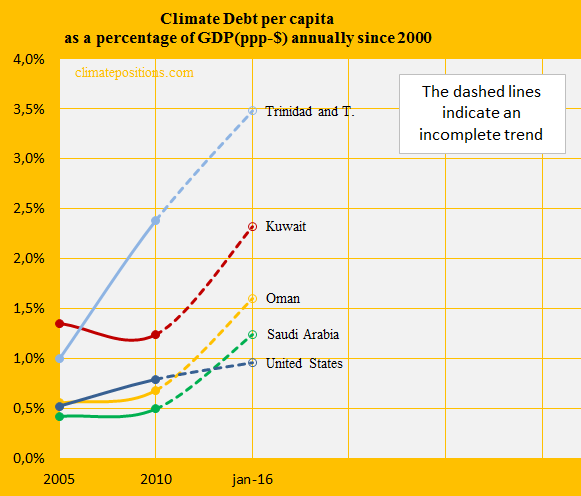
January 2016 the Kuwaiti Climate Debt per capita as share of the GDP(ppp-$), since 2000, was 2.32% annually, which is the 3rd highest among 148 countries (after Trinidad and Tobago and Qatar). The development since 2005 is shown in the diagram below, along with the same group of countries. The turbulent graph is strongly interconnected with changes in the GDP(ppp-$)², which again is related to changes in the oil-marked.
.
¹According to a ‘2015-study in the journal Nature’ (read this ‘Article’ from The Guardian) around 61% of all known extractable gas reserves in Middle East (49% globally) and 38% of all known oil reserves (33% globally) will have to stay in ground beyond 2010 if global warming are to be limited to 2°C.
²Note that historic levels of GDP(ppp-$) has a gradually reduced impact on the Climate Debt in comparison with resent levels.
.
Data on carbon emissions (CO2 Emissions) from fossil fuels (without bunkers) and cement production are from Global Carbon Project (CDIAC); (links in the menu “Calculations”).
Source on Environmental Performance: Yale and Columbia University reports, published 2006-2016 (links in the menu “Calculations”).
Information on national GDP(ppp-$) per capita: Worldbank.
PowerPoint collage with Fawaz (Fawaz Refrigeration & Air-Conditioning and owner of Nottingham Forest Football Club) by Claus Andersen, 2016.
Comments are closed.