Climate Debt: Oman ranks 5th (more emissions to come!)
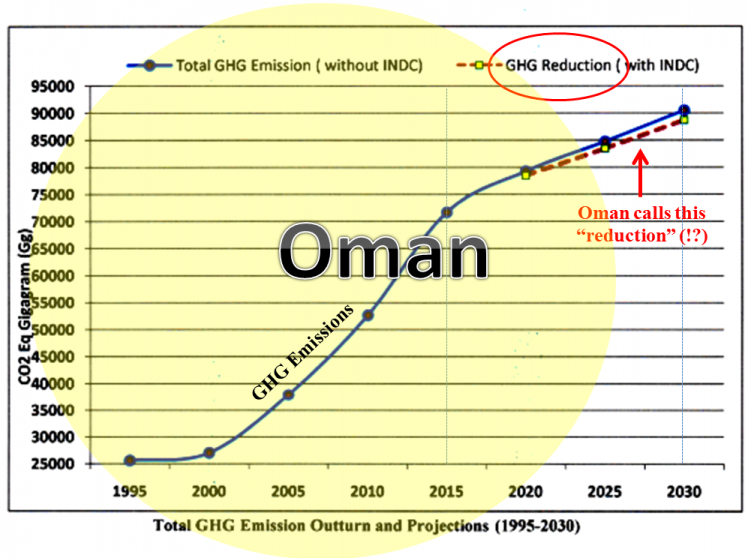
The current Omani Climate Debt, accumulated since 2000, is $9,645 per capita and the ‘Ranking’ is 5th among 148 countries. According to the bizarre Omani ‘COP21 Submission 2015’ the wealthy authoritarian oil state is planning to increase GHG-emissions by only(!?) 22% by 2030 compared to 2015. The implementation of this (extremely climate destructive) target is, even more ludicrous, conditioned upon “assistance provided by the UNFCCC on finance, capacity building and transfer of technology”. The following examines Oman’s CO2 Emissions, Environmental Performance, GDP(ppp-$) and Climate Debt.
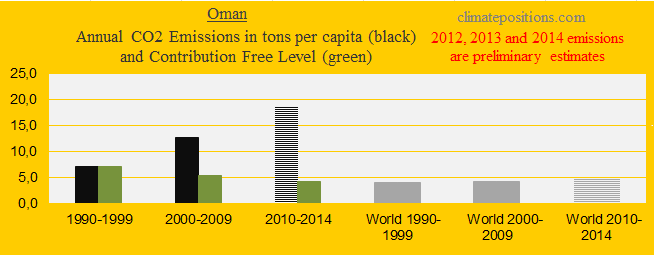
The first diagram (below) shows the per capita CO2 Emissions from fossil fuels (without bunker fuels) and cement production in decades in comparison with the world average. CO2 Emissions since 2012 are preliminary estimates. The green bars are the Contribution Free Level, determined by the level of CO2 Emissions in the 1990s and a number of continuously updated ‘Indicators’.
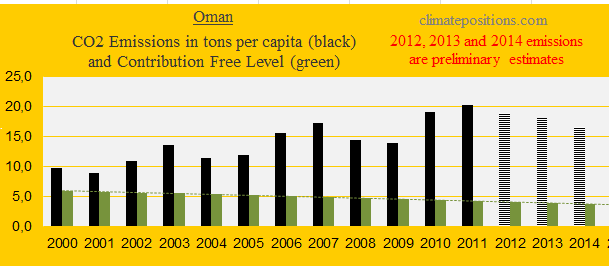
The next diagram shows the per capita CO2 Emissions since 2000. CO2 Emissions in 2012, 2013 and 2014 are preliminary estimates. Emissions in the 1990s were 7.0 tons per capita on average and emissions between 2000 and 2014 were 14.7 tons. The production of oil and natural gas both increased by 33% between 2007 and 2014 (gas: 2013) although the majority of the world’s fossil fuels will have to stay in the ground according to science¹.
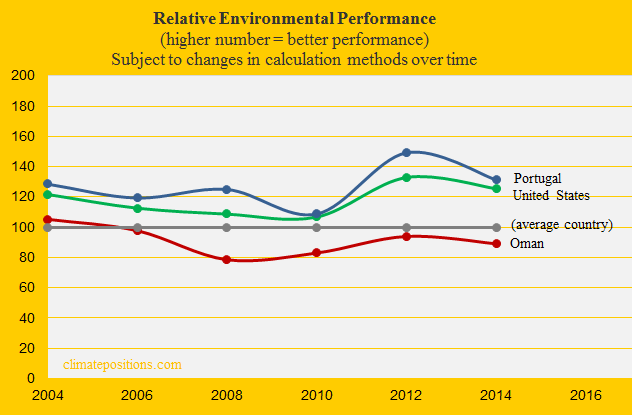
The relative Environmental Performance over time of the Oman, United States and Portugal, with the world’s average set at 100, is shown below. The ‘Environmental Performance Index’ published January 2016 (data-year is set at 2014 in the diagram) ranks Oman 126th among 180 countries. See the ‘Details’ on Oman’s performance. The previous ‘Index published in 2014’ ranked Oman 100rd.
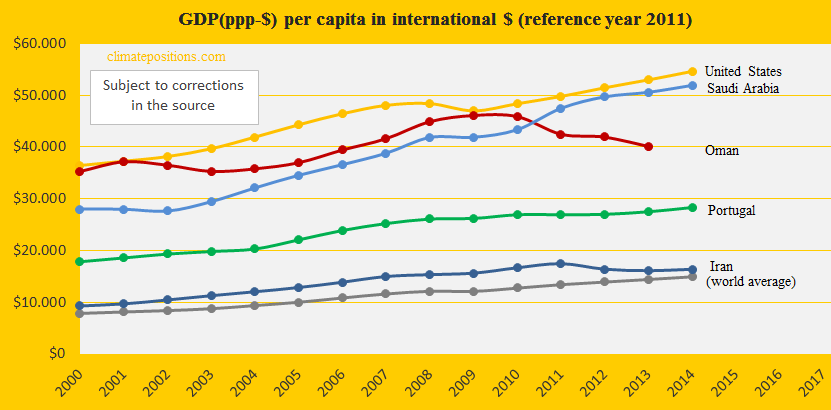
The diagram below shows the Omani development of GDP(ppp-$) per capita since 2000, in comparison with United States, Saudi Arabia, Iran, Portugal and the world average. Since oil and gas are key economic contributors in Oman (hydrocarbons accounting for close to 86% of government revenues in 2013²), both the drop in oil-prices and high population growth-rates (the population grew by 53% between 2009 and 2014) have had significant impact on the graph.
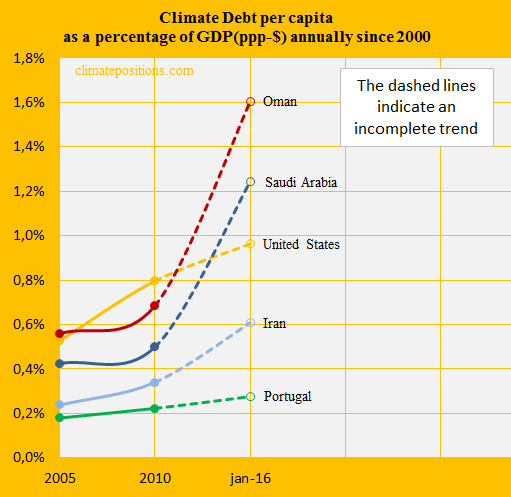
January 2016 the Omani Climate Debt per capita as share of the GDP(ppp-$), since 2000, was 1.60% annually, which is the 4th highest among 148 countries – in 2010 Oman ranked 8th. The development since 2005 is shown in the diagram below, along with the same group of countries. The turbulent graph is strongly interconnected with changes in the per capita GDP(ppp-$)³, which again is related to changes in the oil-marked and the population-growth.
.
¹According to a ‘2015-study in the journal Nature‘ around 61% of all known extractable gas reserves in Middle East (49% globally) and 38% of all known oil reserves (33% globally) will have to stay in ground beyond 2010 if global warming are to be limited to 2°C.
²http://www.oxfordbusinessgroup.com/oman-2015/energy
³Note that historic levels of GDP(ppp-$) has a gradually reduced impact on the Climate Debt in comparison with resent levels.
.
Data on carbon emissions (CO2 Emissions) from fossil fuels (without bunkers) and cement production are from Global Carbon Project (CDIAC); (links in the menu “Calculations”).
Source on Environmental Performance: Yale and Columbia University reports, published 2006-2016 (links in the menu “Calculations”).
Information on national GDP(ppp-$) per capita: Worldbank (links in the menu “Calculations”).
PowerPoint graph of Oman’s 2030-projection of GHG-emissions (from the COP Submission 2015) by Claus Andersen, 2016.
xxx
Comments are closed.