Climate Debt: The United Arab Emirates ranks 4th (climate destruction branded by sports!) … soon with Nuclear Power

The per capita Climate Debt of the United Arab Emirates (UAE), accumulated since 2000, is $11,865, which ranks the rich oil-state 4th among 148 countries (see the ‘Ranking‘ by January 2016). Before proceeding, read these ten pinpoints of the intolerable situation:
- The ‘UAE’ became independent in 1971 and by then it had been generally known for years that burning of Fossil Fuels causes dangerous global warming (read the ‘Early history of global warming science and predictions’).
- Between 1971 and 2014 the UAE emitted an annual average of 35.0 tons of CO2 per capita from fossil fuels (without bunkers) and cement, in comparison with world average of 4.3 tons.
- The UEA is the 4th wealthiest country among 148 with full data in ClimatePositions.
- The UAE is the world’s 8th largest oil producer (and the 3rd largest oil exporter) and the 17th largest gas producer – the proven oil reserves is the 7th largest and the gas reserves is the 6th or 7th largest.
- In 2011, oil exports accounted for 77% of the UAE’s state budget.
- The UEA’s plans to increase oil production by 25%, between 2012 and 2020 – although science finds that 38% of all known oil reserves in Middle East (33% globally) and 61% of all known extractable gas reserves (49% globally) – will have to stay in ground beyond 2010 if global warming is to be limited to 2°C.
- Nearly 100% of the UEA’s electric generation is gas-fired.
- The UEA will introduce Nuclear Power (termed “clean energy”) by 2017 which expects to meet 20% of national power demand by 2020¹ – although dangerous radioactive waste consequently will be left to deal with for thousands of years.
- The UEA’s climate change financing to developing countries is zero.
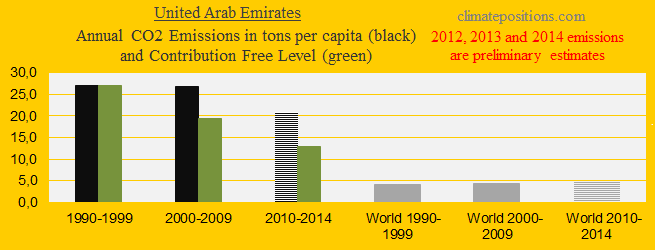
The first diagram (below) shows The UEA’s per capita CO2 Emissions from fossil fuels (without bunker fuels) and cement production in decades in comparison with the world average. CO2 Emissions since 2012 are preliminary estimates. The green bars are the Contribution Free Level, determined by the level of CO2 Emissions in 1990s and a number of continuously updated ‘Indicators’. The reductions are too unambitious and way too late considering the hazard.
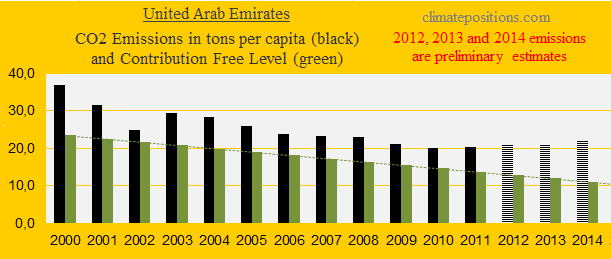
The next diagram shows the UEA’s per capita emissions (without bunker fuels) since 2000; emissions from 2013 and 2014 are preliminary estimates. Renewable energy’s share of the total electric generation was only 0.02% in 2012 (0.002% of the total energy production). So far, reductions solely materialized between 2001 and 2010, and 2014-emissions are stagnant huge: 21.8 tons (preliminary estimate).
The diagram below shows the per capita GDP(ppp-$) since 2000 of the UEA and four other Fossil Fuel producers: Saudi Arabia, Canada, Kazakhstan and Iran – and the world average. UEA’s decline in GDP(ppp-$) between 2003 and 2010 just about correlate with a dramatic Population growth from 3.6 million in 2003 to 8.3 million in 2010 (of which only about 13% were UAE Emiratis, while the large majority were expatriates) – and the decrease of per capita CO2 Emissions. One might ask if low-paid and low-emitting expatriates are the main substance of the UEA’s green growth strategy, so far.

The UEA’s Climate Debts share of the GDP(ppp-$) was 1.08% annually since 2000 (ranks 7th; see the ‘Ranking‘). The development since 2005 is shown in the diagram below, along with the same group of countries.

A different viewpoint on the United Arab Emirates: Companies, such as Fly Emirates, are of cause subsidized and branded by fossil fuel revenue regardless the costs of global climate destruction. Today, Fly Emirates is the world’s largest airline in the world in terms of international passenger-kilometers flown and Dubai International Airport is the busiest airport in the world by international passenger traffic. The list of high-profile sports worldwide displaying Emirate-slogans are endless; read in ‘Wikipedia’.
¹’www.irena.org‘ (pdf p. 13).
.
A hypothetical example: If the United Arab Emirate (the UAE) paid its Climate Debt of $108 Billion (or $32 per tons CO2 emitted nationally from fossil fuels (without bunkers) and cement, between 2000 and 2014, to a fictive Climate Fund, then the country would be free of Climate Debt and thus qualify for financial support from the fund.
.
Data on carbon emissions (CO2 Emissions) from fossil fuels (without bunkers) and cement production are from Global Carbon Project (CDIAC). Data on population is from Worldbank. Links are available in the menu “Calculations”.
Information on national GDP(ppp-$) per capita: Worldbank (links in the menu “Calculations”).
Masdar Institute report on UAE’s renewable energy by 2030: ‘http://www.irena.org/remap/IRENA_REmap_UAE_report_2015.pdf‘
Background information: ‘https://en.wikipedia.org/wiki/United_Arab_Emirates‘.
PowerPoint collage of Fly Emirates’ sponsorships in football: Real Madrid (Ronaldo), Paris St-Germain (Ibrahimocic) and Arsenal (Özil), by Claus Andersen, 2016.
Comments are closed.