Climate Destruction League: Bahrain vs. Oman

2015
The small authoritarian Islamic oil regimes of Bahrain and Oman are ranked 6th and 8th among 147 countries on the worst performing list (see the ‘ranking’). 0.06% of the global population lives in Bahrain or Oman and together they emitted 0.30% of the global CO2 from fossil fuels in 2012 – their joint share of the global Climate Debt is around 0.66%. Bahrain’s per capita Climate Debt is now $8,668 and Oman’s is $8,077. Renewable energy and global climate change financing are largely non-existent in both countries. Welcome to Climate Destruction League.
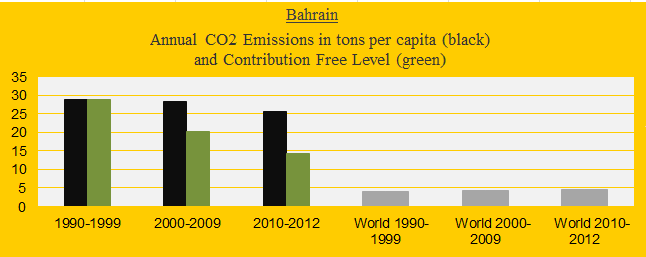
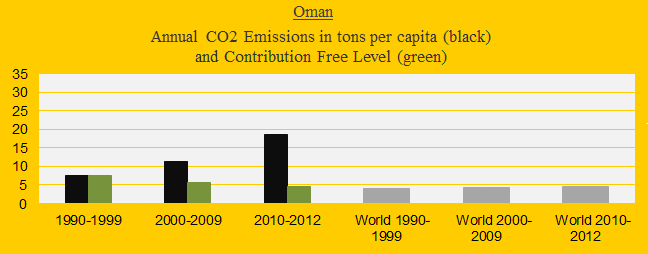
The first two diagrams show the CO2 Emissions per capita in decades (black bars) in comparison with the world average (grey bars). The green bars show the Contribution Free Level in ClimatePositions – the free level is determined by the level of CO2 Emissions in the 1990s and a number of continuously updated ‘indicators’.
Note that the Bahraini population has doubled between 2000 and 2014 (almost 55% of the population is immigrants¹), while Oman’s population has increased by a third over the same period. Increases of total CO2 Emissions from fossil fuels and the total Climate Debts are therefore even more catastrophic than per capita trends.
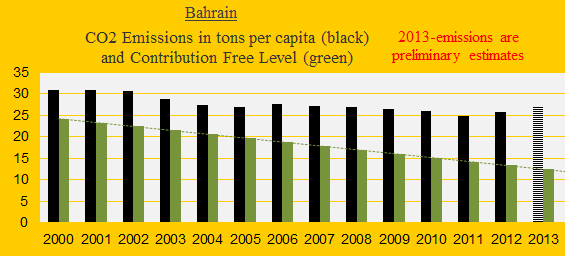
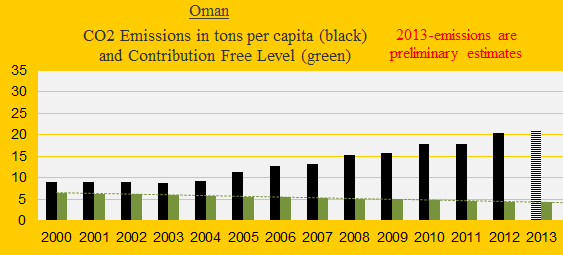
Per capita CO2 Emissions annually since 2000 are shown in the diagrams below. The Bahraini reduction rate is alarmingly low, considering the extreme level of emissions. In fact, Bahrain’s average per capita emissions 1991-2011 were 2.3% higher than in 1990 (the total emissions were 57% higher due to the population growth). Oman’s average per capita emissions 1991-2011 were 50% higher than in 1990 (the total emissions were 129% higher).
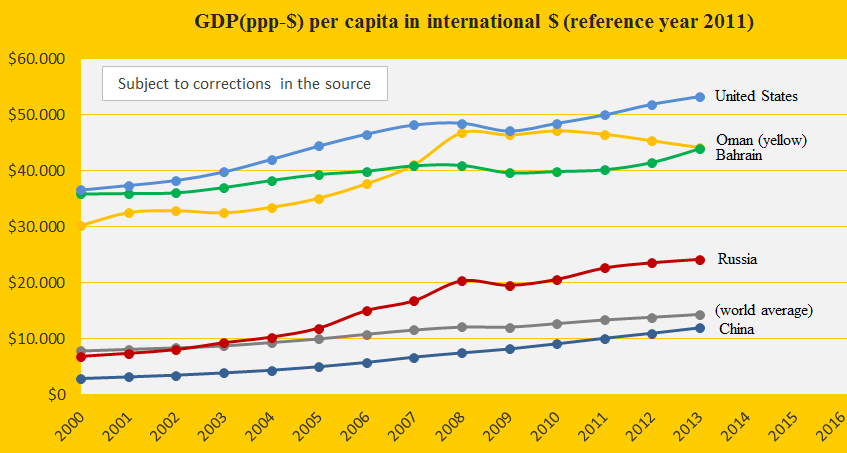
The next diagram shows the GDP(ppp-$) per capita of Bahrain, Oman, United States, China, Russia and the world average. The first three are among the 18 richest countries in the world, with 8% of the world’s population.
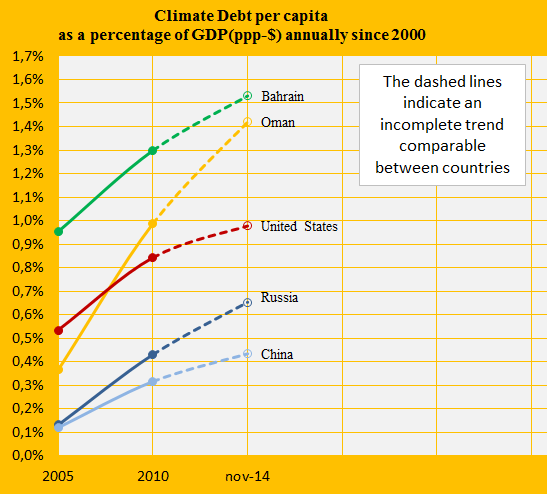
The diagram below shows the accumulated Climate Debt as percentages of the GDP(ppp-$) annually since 2000, of Bahrain, Oman, United States, China and Russia. See the ‘ranking’.
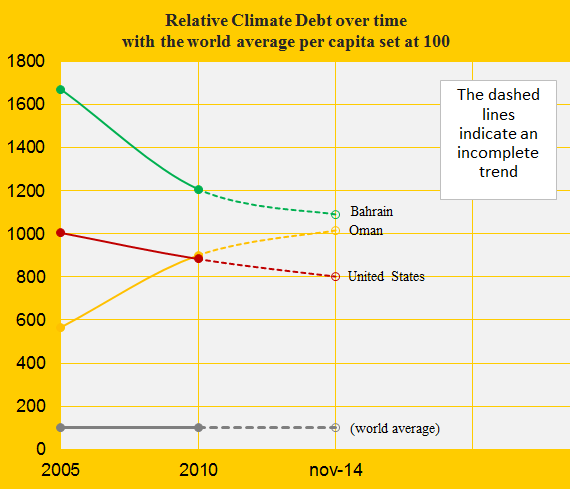
The last diagram (below) shows the relative Climate Debt since 2005 of Bahrain, Oman and United States, with the world average set at 100. Economic growth without appropriate CO2 Emission reductions leads to an up-going curve. Note that the dashed lines are incomplete trends based on preliminary estimates. The pathways to Climate Destruction League of the two Middle East countries are very different.
.
¹According to UN data (2013) (source: ‘theodora.com‘).
.
A hypothetical example: Had Oman maintained the level of CO2 Emissions per capita since 1990s (7.5 tons) until today, and all other indicators were unchanged, then the present Climate Debt would have been below $7 Billion instead of $25 Billion.
.
Source on CO2 Emissions: EIA, U.S. Energy Information Administration and data on preliminary national CO2 Emissions are from Global Carbon Project (links in the menu “Calculations”).
Information on national GDP(ppp-$) per capita: Worldbank (links in the menu “Calculations”).
Data on national and global Populations: EIA, U.S. Energy Information Administration (links in the menu “Calculations”).
Drawing by Claus Andersen, 2015.
Comments are closed.