Climate performance: Libya versus Chad
2014
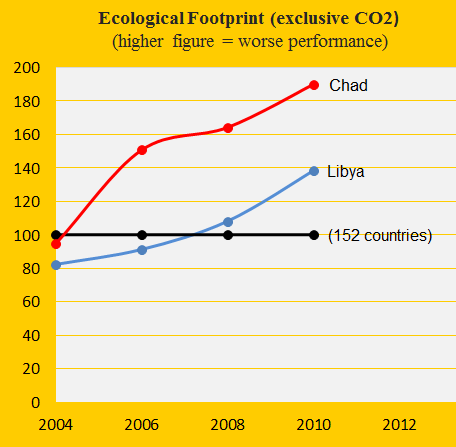
Libya was the 29th worst performing country out of 145 in ClimatePositions 2010 and thus the worst performing country in Africa (read more ‘here’). The authoritarian oil-regime’s Climate Contribution (climate debt) has increased to $819 per capita in the updated calculation. Chad is Contribution Free in spite of a surprisingly large Ecological Footprint (excluding CO2 Emissions) – see the diagram. The large footprint is partly due to large herds of commercial cattle, goats, sheep, horses and donkeys. The following examines the indicators: CO2 Emissions, GDP(ppp-$) and the Climate Contributions over time.
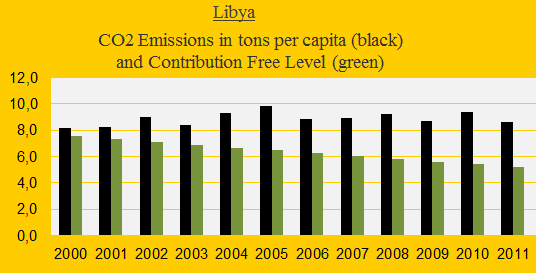
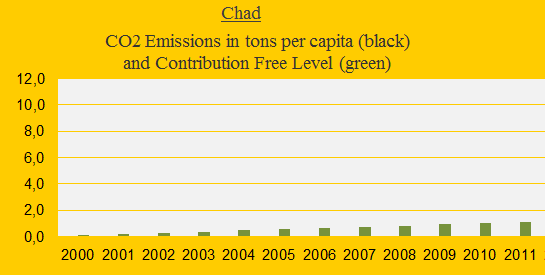
The diagrams below show the two country’s CO2 Emissions (carbon dioxide) and the Contribution Free Level (the green bars) since 2000. Libya has performed very poorly while Chads CO2 Emission is insignificant: between 0.02 and 0.03 tons per capita (can’t even be seen in the diagram!). Note that only a fraction of the unused national CO2 Emissions quota in 2000-2019 will be transferred to ClimatePositions 2020-2039, while the national excesses (as Libya’s) will be transferred in full.
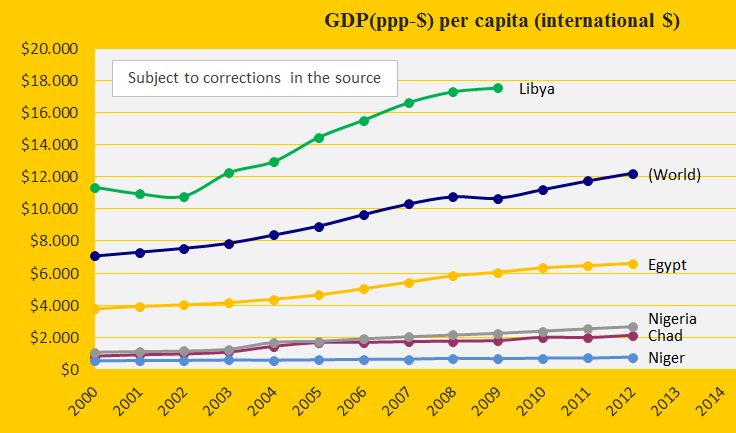
The diagram below shows the development in GDP(ppp-$) for Libya, Egypt, Nigeria, Chad and the world average. Oil is money and opportunities for Libya and poison for the atmosphere and the climate. By the way, Life Expectancy is 77.8 years in Libya (the highest in Africa) and 48.7 years in Chad (the lowest in Africa).
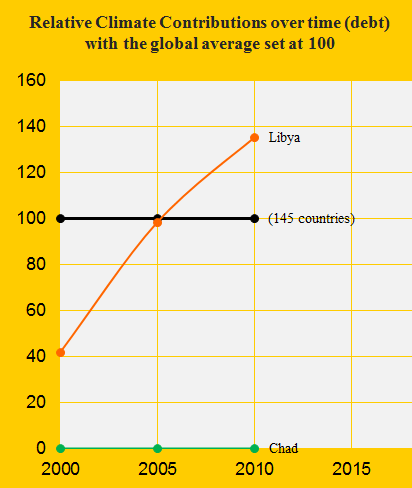
The last diagram (below) shows the relative Contributions in 2000-2010 with the global average set at 100. The Libyan trend is entirely negative while Chad is Contribution Free.
A hypothetical example: Had Libya remained at the 2000 level of CO2 Emissions the Climate Contribution would have been $588 per capita today instead of $819 (a total saving of $1.5 billion).
Source on ecological footprint: WWF reports “The Living Planet” published 2006-2012 (links in the menu “Calculations”).
Source on CO2 emissions: EIA, U.S. Energy Information Administration (links in the menu “Calculations”).
Information on national GDP(ppp-$) per capita: Worldbank (links in the menu “Calculations”).
Comments are closed.