Climate performance of Nigeria and neighboring countries
2014
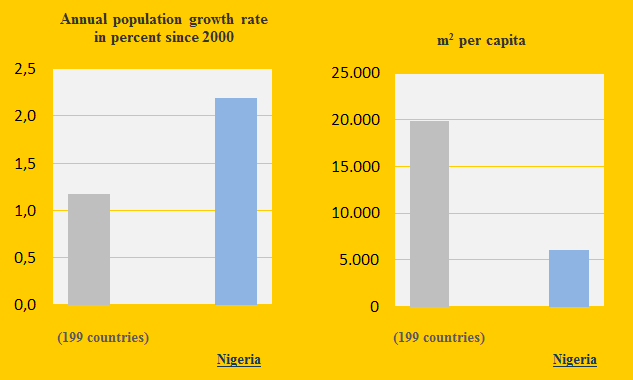
Nigeria and the neighboring countries Benin, Niger, Chad and Cameroon are Contribution Free in ClimatePositions. Nigeria is the world’s 8th most populous country and the annual population growth rate since 2000 is 2.2% or almost twice the world average (see the first diagram). The following examines the indicators of Forest, GDP(ppp), Environmental Performance, Ecological Footprint and CO2 Emissions (carbon dioxide).
The forest cover of Nigeria was 18.9% in 1990 and 9.9% in 2010 (see the diagram below). Nigeria is said to have the highest deforestation rate of natural forest on the planet and here we talk about varied nature with striking biodiversity such as mangrove forests and coastal rainforests, etc. (read ‘more’). Benin and Cameroon also has catastrophic deforestation rates but at higher levels of total forest cover.

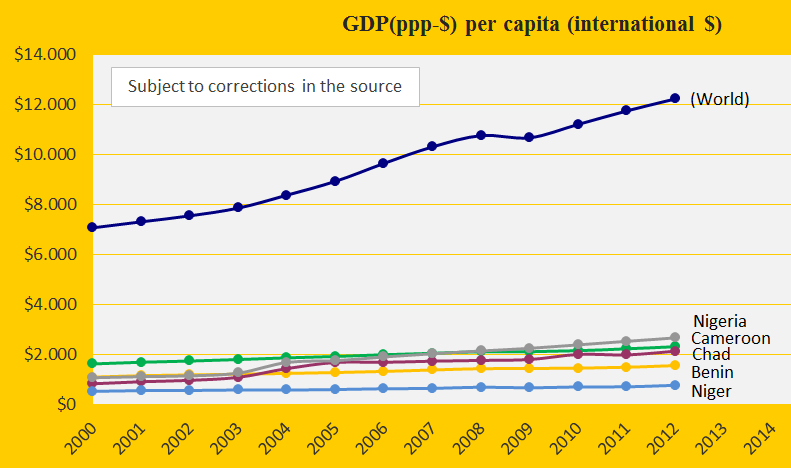
Last year Nigeria overtook South Africa as being Africa’s largest economy. However, the Nigerian GDP(ppp) per capita is only the 15th largest among 43 countries on the continent. The diagram below shows the development since 2000 compared with the neighboring countries and the world average.
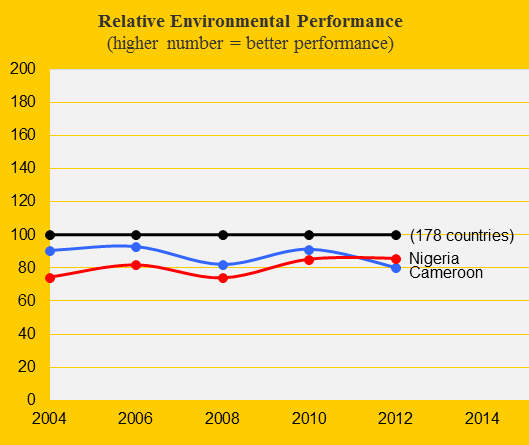
The Environmental Performance of Nigeria is below the world average (see the diagram) though slightly better than the neighboring countries in 2012. See the overall environmental scores of Nigeria ‘here’.
The Ecological Footprint (without CO2 Emissions) of Nigeria has increased the last six years (see the diagram below) and passed the world average in 2006 mainly caused by cropland. Today one third of Nigeria’s land area, are under cultivation. Read about the ‘Nigerian agriculture’. Niger and Chad have even larger footprints whereas Benin and Cameroon have smaller. An update of Ecological Footprint is expected in the autumn of 2014.

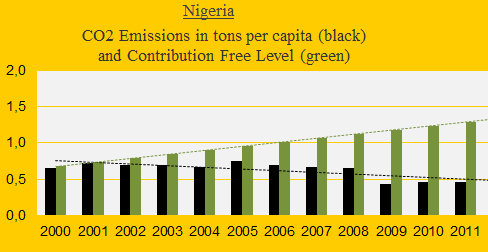
The low levels of CO2 Emissions per capita in Nigeria have decreased further since 2005 (the diagram below shows the development since 2000). The green bars show the Contribution Free Level. In 2011 the Nigerian CO2 Emissions was 0.46 tons per capita (a reduction of 46% since 1990s). The neighboring countries emitted: Benin 0.50 tons, Cameroon 0.41 tons, Niger 0.08 tons and Chad 0.03 tons. The world average was 4.69 tons. Note that only a fraction of the unused emissions will be transferred to ClimatePositions 2020-2039.
Nigeria is the 12th largest oil producer in the world and has the 10th largest proven reserves. During the oil boom of the 1970s, Nigeria accumulated a large foreign debt to finance new infrastructure. With the falling oil prices in the 1980s the country defaulted on its loans and penalty interest increased the size of the debt. In 2005 Nigeria repurchased its debt (estimated $30 billion) at a discount of approximately 60% and in 2006 Nigeria became the first African country to pay off its debt (‘Wikipedia’). Unfortunately, the Nigerian economy remains dependent on revenues from oil production.
If all the 80 debtor countries in ClimatePositions 2010 paid their Climate Contributions (debt) to a Global Climate Fund and the financing hypothetically were evenly spread to all the 145 included countries, then Nigeria would receive $64 billion to sustainable projects (such as rainforest conservation projects) – more than twice the estimated national debt in 2005. See the country ranking of total climate debt in 2010 in the menu “Contributions/Total US$ Rank”.
Source on Ecological Footprint: WWF reports “The Living Planet” published 2006-2012 (links in the menu “Calculations”).
Information on national GDP(ppp-$) per capita: Worldbank (links in the menu “Calculations”).
Source on CO2 Emissions: EIA, U.S. Energy Information Administration (links in the menu “Calculations”).
Data on national and global Populations: EIA, U.S. Energy Information Administration (links in the menu “Calculations”).
Source on Environmental Performance: Yale and Columbia University reports, published 2006-2014 (links in the menu “Calculations”).
Comments are closed.