Czech Republic – per capita Fossil CO2 Emissions and Climate Debt
2020
The current Climate Breakdown Pricing of Czech Republic amounts to $15.33 per tons Fossil CO2 emitted since 2000. The Climate Debt grew from $1,398 per capita in 2015 to $3,356 in 2020. Updated Rankings of 165 countries are available in the menu “Climate Debt”.
The following diagrams expose the trends of Fossil CO2 Emissions, Climate Debt, GDP(ppp-$) and Nuclear Power.
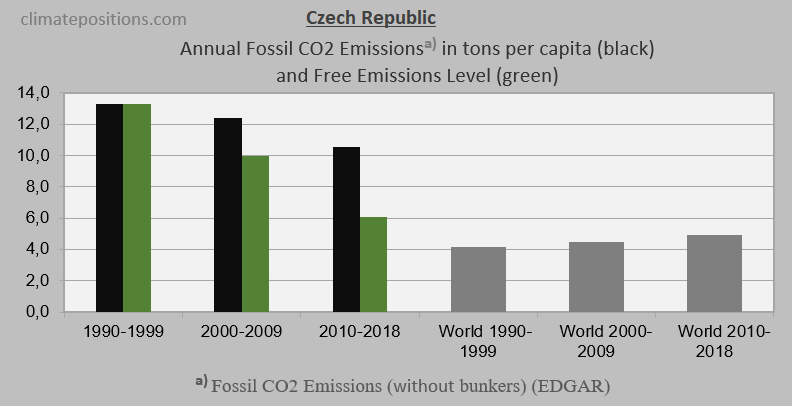
The first diagram shows the Fossil CO2 Emissions per capita annually between 2000 and 2018. The green bars show the Free Emissions Level. The gap between the green and the black line is the calculation bases of the Climate Debt.

The second diagram shows Fossil CO2 Emissions in tons per capita in decades. Again, the green bars show the Free Emission Level. The grey bars are World Fossil CO2 Emissions average.
The third diagram shows the Climate Debt as ‘Share of global Climate Debt‘ in 2010, 2015 and 2020, of Czech Republic, Slovakia and Hungary.

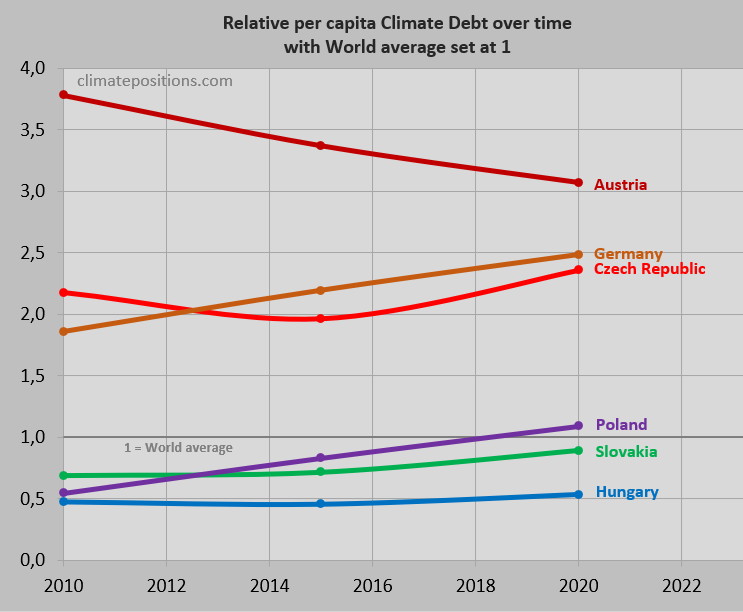
The fourth diagram shows the ‘per capita Climate Debt‘ trends between 2010 and 2020, with World average set at 1, of Czech Republic, Slovakia, Hungary, Germany, Poland and Austria.
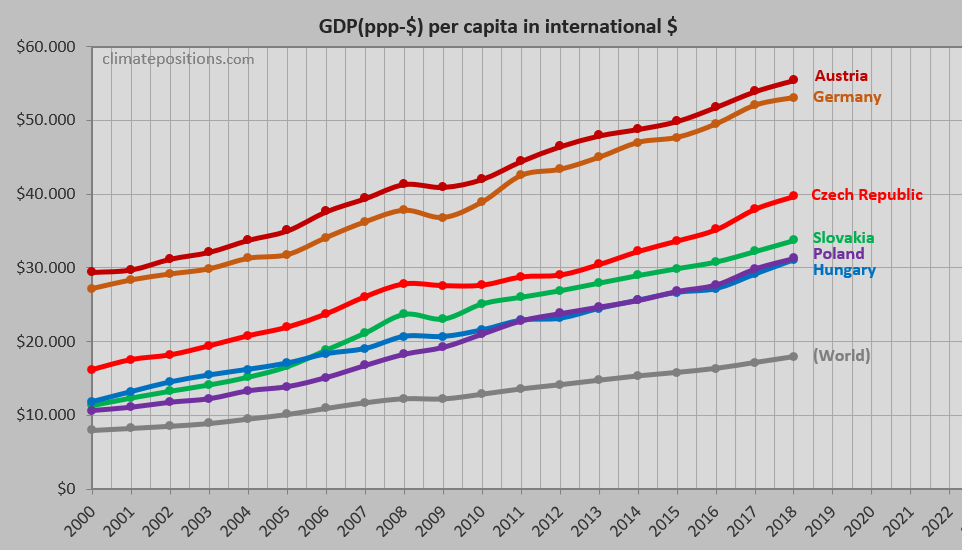
The next diagram shows per capita GDP(ppp-$) of the same six countries and World average.
In the calculation of Climate Debt, the unacceptable Nuclear Power is converted into CO2 Emissions as if the electric power was produced with oil. As a consequence, Nuclear Power must be phased out at the same rate as Fossil CO2 Emissions. The diagram below shows the per capita Nuclear Power generation of Czech Republic, Slovakia and Hungary. Had Czech Republic shut down Nuclear Power back in 2000, then the current Climate Debt would decrease by 17% ($2,795 per capita instead of $3,356).
![]()
.
Updated data and diagrams of all ‘Indicators‘ and countries in ClimatePositions are available in the sub-menu ‘Calculations (Excel)‘.
Data on Fossil CO2 Emissions (excluding international shipping and aviation) including industrial processes (cement, steel, liming, etc.) are from EDGAR (European Commission) (links in the menu Calculations / Sources & Links). Direct link ‘here‘.
Information on national GDP(ppp-$) per capita: Worldbank (links in the menu Calculations / Sources & Links).
Data on national Nuclear Power generation: World Nuclear Association (links in the menu Calculations / Sources & Links).
Drawing/illustration by Claus Andersen, 2020.
Comments are closed.