European Union perform poorly

2013
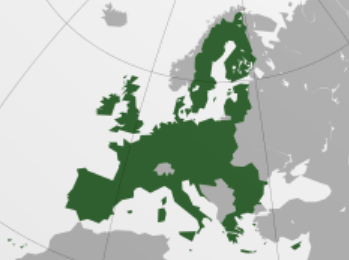
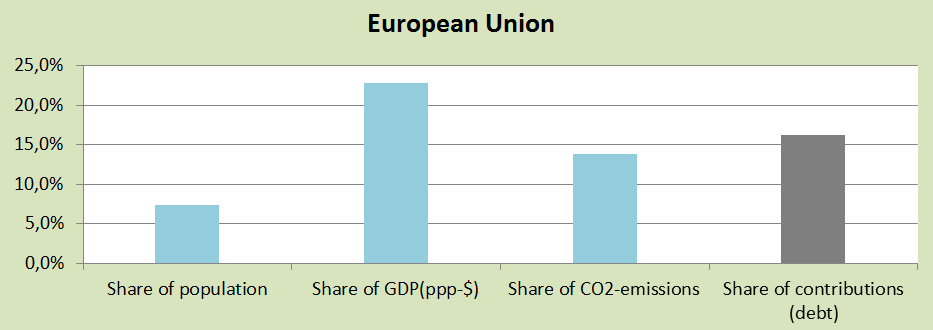
The map (from Wikipedia) shows the very different countries in ‘European Union‘ (EU). As a whole EU perform poorly on the climate challenge and only Romania was Contribution Free in ClimatePositions 2010. Both Netherlands and Belgium are among the top 10 worst performing countries in the world. Se the EU rank at the end and the global ranking in the menu “Contributions/Per Capita US$ Rank”). The diagram below is from ClimatePositions 2010 and show EU’s total share of the global: 1) Population (7.4%), 2) GDP(ppp-$) (22.7%), 3) CO2 Emission (2006-2010) (13.8%) and 4) Contribution (16.2%). Apart from North America, EU is the poorest performing region in the world.
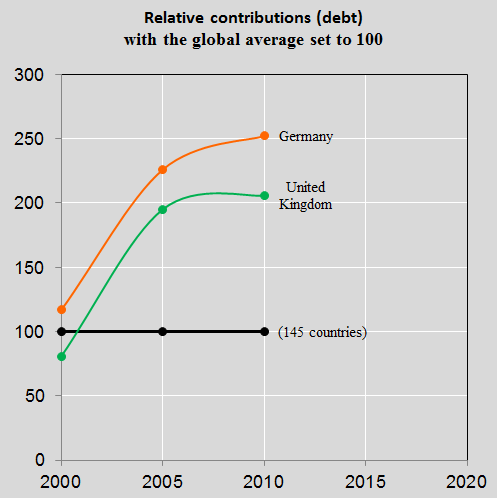
Germany and United Kingdom are among the top 10 largest CO2 Emitters (carbon dioxide) in the world. The diagram below show the two countries performance over time with the global average set at 100. United Kingdom defeats Germany in the “bottom of 4th division.”
Climate Contribution per capita (climate debt) in European Union in 2010:
- Netherlands $3.092
- Belgium $2.619
- Ireland $2.123
- Finland $1.757
- Austria $1.536
- Estonia $1.248
- Greece $1.213
- Spain $1.151
- Germany $1.065
- Slovenia $987
- France $897
- United Kingdom $870
- Italy $720
- Czech Republic $662
- Sweden $654
- Denmark $612
- Portugal $574
- Slovakia $391
- Poland $232
- Hungary $227
- Bulgaria $219
- Latvia $76
- Lithuania $47
- Romania (contribution free)
Source on CO2 emissions: EIA, U.S. Energy Information Administration (links in the menu “Calculations”).
Information on national GDP(ppp-$) per capita is from Worldbank (links in the menu “Calculations”). Read about GDP+ in the submenu ”Indicators”.
Data on national and global populations are from the EIA, U.S. Energy Information Administration (links in the menu “Calculations”).
Comments are closed.

