Fossil CO2 Emissions: European Union, United States and China (Per capita and Total)
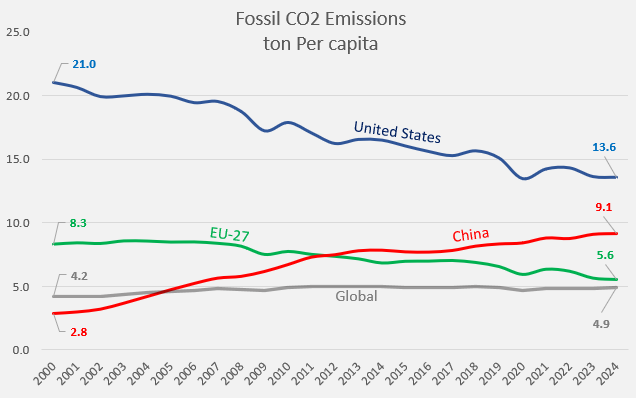
/2025/ The graphs below show the Fossil CO2 Emissions in tons Per capita from EU-27 in comparison to the United States, China and global emissions. Chinese emissions Per capita exceeded the global average around 2004 and EU-27 around 2011.
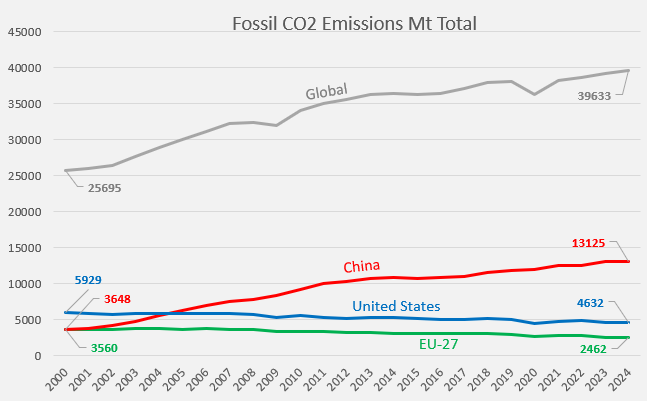
The Total Fossil CO2 Emissions are shown below. Global emissions have increased by 54% since 2000. China’s share of Global Emissions has increased from 14% to 33% in 25 years.
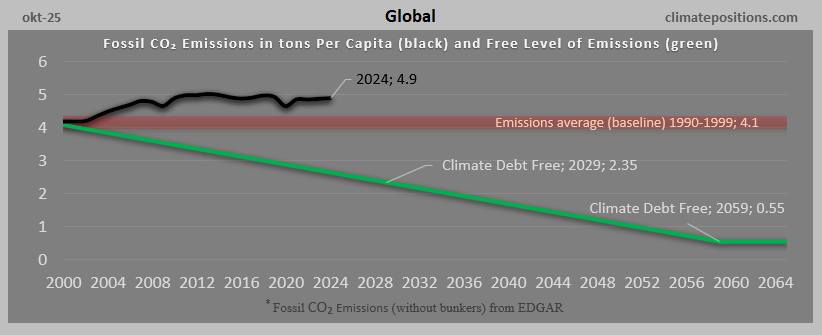
Below are the Global Fossil CO2 Emissions Per capita and the required reduction rate (Free Level of Emissions) in ClimatePositions. Calculations of the Global Climate Debt are only possible by adding up the countries’ individual Climate Debts.
The table shows the accumulated Climate Debt between 2000 and 2025. EU-27 is calculated by adding up the member states’ Climate Debt, and the same applies to the Global Climate Debt.
| . | Climate Debt | Climate Debt | Climate Debt |
| . | Per capita | Total, Billion | Global share |
| United States | $6,412 | $2,181 | 23.54% |
| China | $1,915 | $2,698 | 29.12% |
| EU-27 | $1,539 | $692 | 7.47% |
| Global | $1,149 | $9,265 | 100.00% |
Comments are closed.