Global Indicator Updates 2016: Sea Level, Population and CO2 Content in the atmosphere
2017
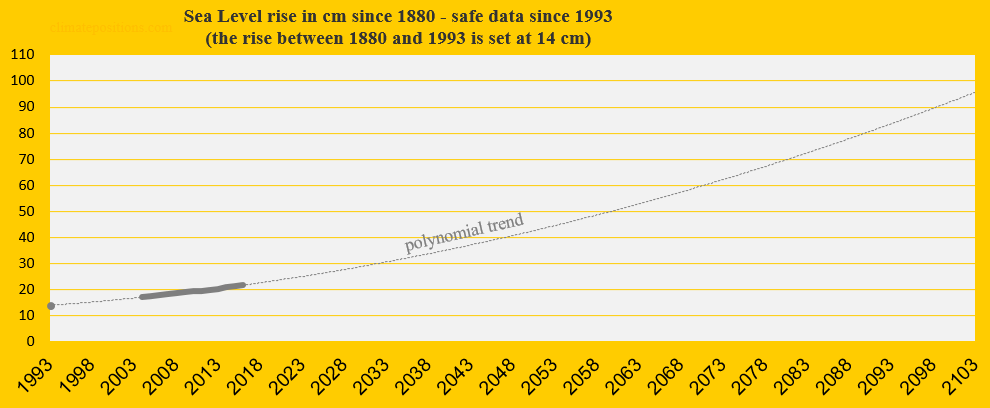
The estimated annual global Sea Level rise since 1993 increased from 3.3 mm (±0.4 mm) in 2015 to 3.4 mm (±0.4 mm) in 2016. The increase suggests an accelerating rate of Sea Level rise, which is illustrated in the diagram below. The growing volume of the oceans is caused by two effects of global warming: melting ice and warmer oceans. In ClimatePositions the Sea Level rise between 1880 and 1993 is set at 1.2 mm annually, or 14 cm during the 113-year period. The total estimated Sea Level rise between 1880 and 2016 adds up to 21.82 cm and this figure is used as an ‘Indicator‘ in ClimatePositions.
The Sea Level rise between 2004 and 2016 is shown below (Sea Level 1880 and 1993 is set at 0 cm and 14 cm, respectively) – the unscientific polynomial trend line projects the scary tendency by 2100.
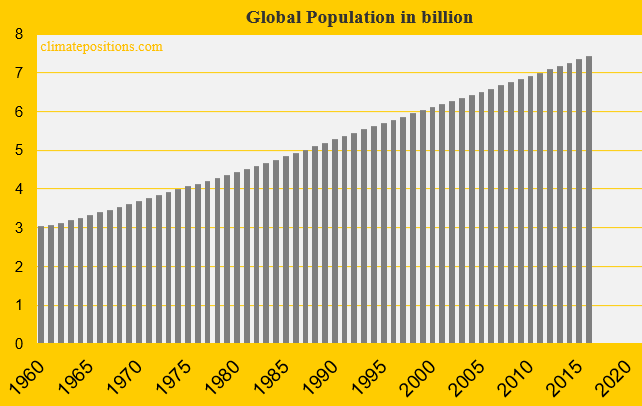
Global Population is growing around 86 million, annually. However, growing life expectancy and falling birth rate pulls in opposite directions – combined the two trends add up to a predicted Global Population of 8.5 billion by 2030, 9.7 billion by 2050 and 11.2 billion by 2100.
The carbon dioxide (CO2) content in the atmosphere reached 404.21 ppm (parts per million) in 2016 (mean). In 2015 it was 400.83 ppm – the annually updated figure is used in ClimatePositions. The shocking increase 1960-2016 is shown below. The pre-industrial CO2 level was below 300 ppm and 350 ppm is considered the relatively climate-safe limit. Past 400,000 years, until around 1850, the level was between 180 and 300 ppm.
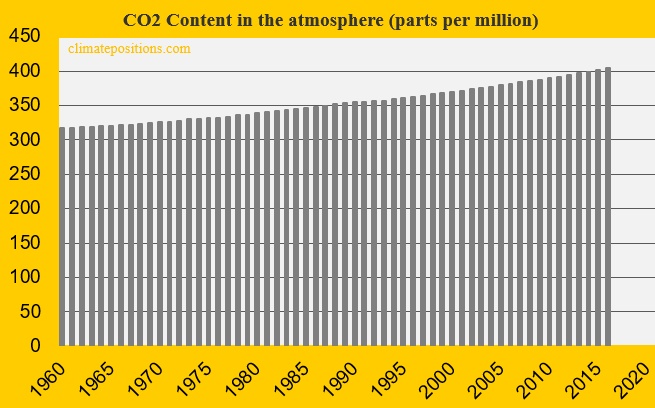
Human-caused CO2 Emissions from Fossil Fuels is the main cause of global warming, melting ice sheets, Sea Level rise and escalation of extreme weather events. Note that annual global CO2 Emissions from Fossil Fuels has flatten out the last three years, however, the impact from uncontrollable ‘Feedback mechanisms‘ is predicted to become increasingly more damaging.
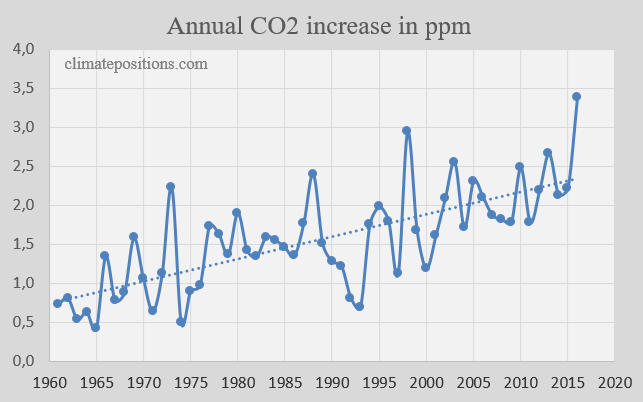
The diagram below shows the annual increase of CO2 Content in the atmosphere (ppm) 1960-2016, with a linear trend line. Between 1850 and 1960 the average increase was around 0.2 ppm, annually.
.
National Climate Debts increase due to Sea Level rise, Population growth and growing CO2 Content in the atmosphere. Combined, the 2016-updates of the three global ‘Indicators‘ caused the per capita Climate Debt of the United States to increase by $195, while China’s increased by $21 and India’s by $2.
.
Data on global Sea Level: University of Colorado (links in the menu “Calculations”).
Sources on CO2 in the atmosphere: NOAA Earth System Researth Laboratory (links in the menu “Calculations”). Data on historic carbon dioxide in the atmosphere is from Wikipedia.
Data on global Population is from Worldbank (links in the menu “Calculations”).
Drawing by Claus Andersen, 2017.
Comments are closed.