Global land temperature January-April is creepy feverish (see the graph 1880-2016)
The world’s two largest economies and carbon dioxide emitters, the United States and China, have thwarted the negotiations toward a globally binding climate agreement for decades. Instead, the world is left with “intended nationally defined contributions” and the “aggregate emission pathways consistent with holding the increase in the global average temperature to well below 2°C above preindustrial levels and pursuing efforts to limit the temperature increase to 1.5°C.” This is of cause warm air, so to speak.
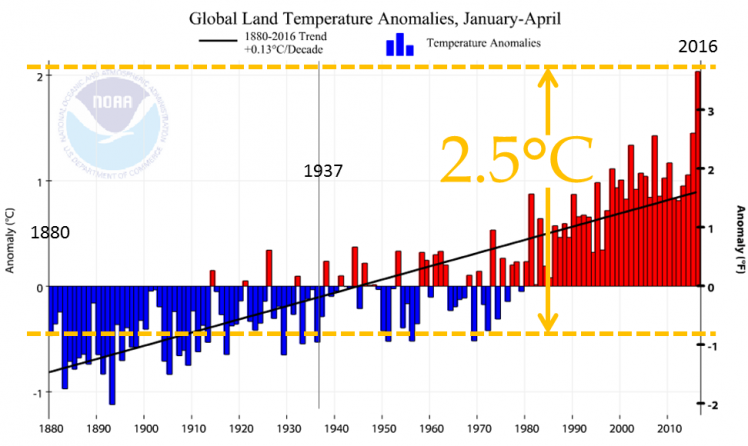
The graph on top shows what’s happening out there: The global land temperature January-April 2016 was 2.5ºC higher than the average temperature January-April between 1880 and 1937, which about matches the year 1880 (calculated by ClimatePositions). The black line shows the 136-year-trend. Compose your own graph at ‘http://www.ncdc.noaa.gov/cag/time-series/global’. Read also this article from The Guardian: ‘April breaks global temperature record, marking seven months of new highs‘.
Today, the United States and China combined are responsible for more than 50% of the global Climate Debt in ClimatePositions and 42% of the global CO2 Emissions from fossil fuels and cement production (preliminary 2014). Rankings are available in the menu “Climate Debt”.
.
Data source on global Air Temperature (including the graph prior to the yellow additions and year-labels) is from: NOAA National Climatic Data Center (links in the menu “Calculations”).
Comments are closed.