Global losses due to climate change
2014
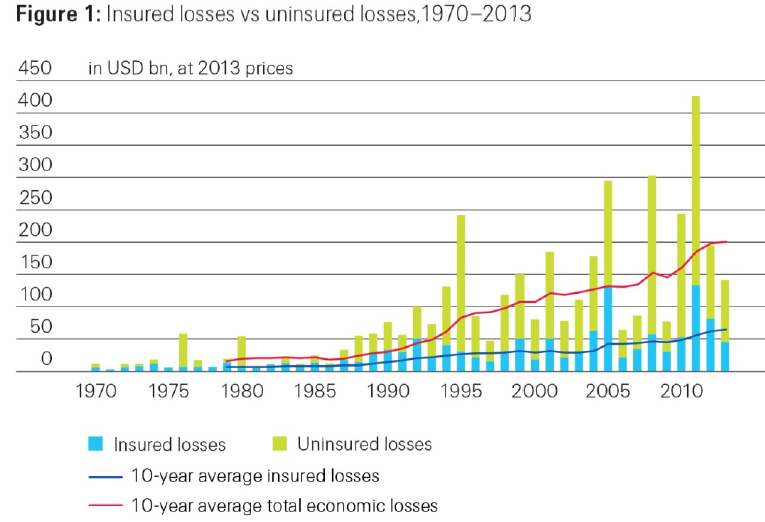
Manmade climate change leads to increased frequency, intensity and duration of extreme weather events. The global losses due to climate change are of course impossible to quantify but the losses accumulated by global reinsurance companies¹ may provide a clue of the seriousness of the situation. The two diagrams below show statistics of ‘Swiss Re’ (see this ‘release’) and ‘Munich Re’ (from The World Bank Report ‘Building Resilience’). The overall picture is similar: Global losses due to extreme weather events have increased dramatically since the 1980s and are now around $150-200 billion annually.
.
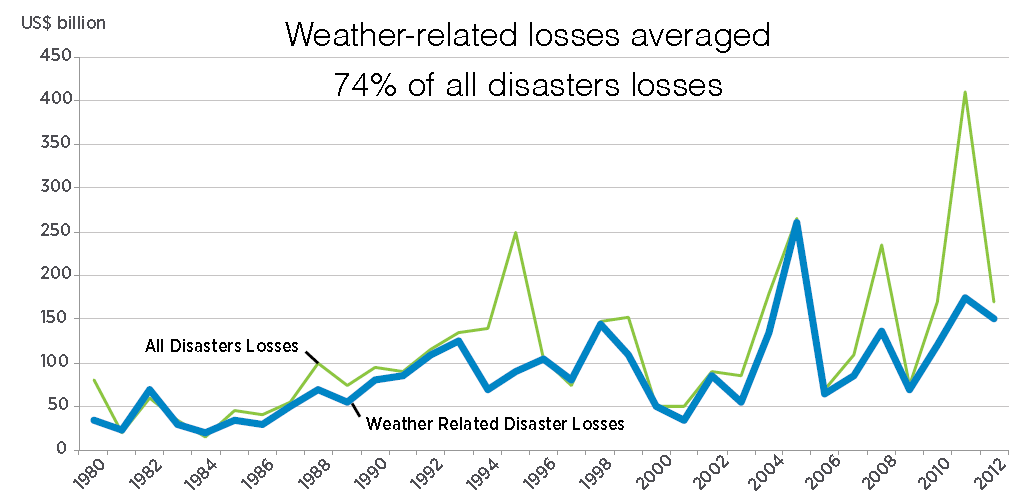
The total losses worldwide due to extreme weather events are estimated by the same two reinsurance companies. Swiss Re reaches $1,400 million for the 10-year period 2004-2013, and Munich Re (from The World Bank Report) reaches $2,800 billion (74% of all disaster losses) from 1980 to 2012. For comparison ‘Germanwatch’ mention the figure $1,680 billion from 1992 to 2011.
If all the negative consequences of climate change were to be included, then economic losses obviously would increase significantly. Take the spread of invasive species, pests and diseases (such as malaria), loss of well-known crop and fishing opportunities, absence of long-term development, etc. Who can estimate the value of human suffering, loss in biodiversity and mass extinction of species, partly caused by the burning of fossil fuels and the unnaturally rapid global warming?
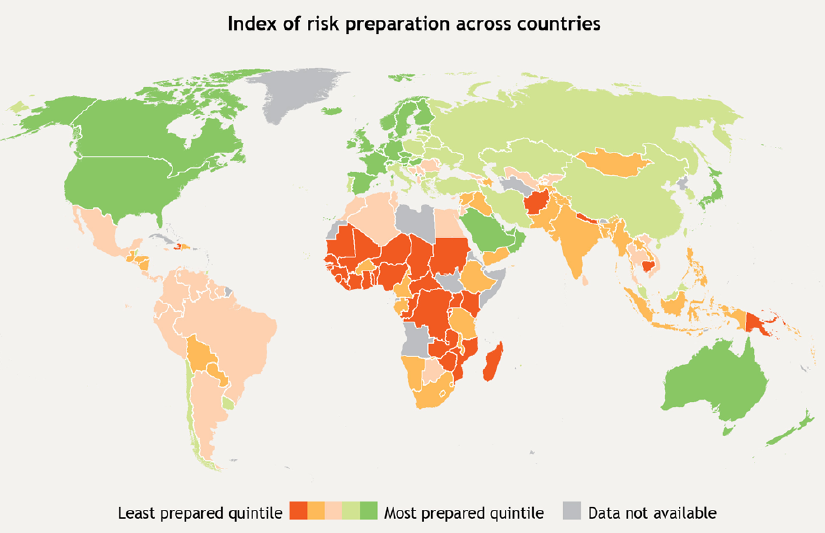
The countries’ preparedness to resist the varying threats from climate change (extreme weather events) is very different. The world map below (from The World Bank Report) shows the current “risk preparation”, in five levels. Almost all of the top 20 worst performing countries in the ClimatePositions (se the ranking of 145 countries ‘here’) are “most prepared”.
In the Germanwatch report ‘Global Climate Risk Index 2013’ the economic losses due to extreme weather events of 183 countries (based on data from 1992 to 2011) are listed as a percentage of GDP. The losses vary from 0.0 to 8.5% (Kiribati) of GDP. The table below compares the twenty most populous Contribution Free countries in ClimatePositions with the twenty worst performing countries with regard to 1) Losses due to extreme weather events as a percentage of GDP (Germanwatch) and 2) Climate Contribution (climate debt) as a percentage of GDP (ClimatePositions). The overall picture is clear: The twenty countries most responsible for the climate catastrophe are the least vulnerable to extreme weather events.
| Losses and Contributions (climate debt) | ||
| Losses due to extreme weather events | Losses | Contribution |
| 1992-2011 (German Watch) | Share of GDP | Share of GDP |
| 20 most populous, Contribution Free countries | 0.33% | 0.00% |
| 20 countries with the largest Contribution (debt) | 0.20% | 0.77% |
.
¹ Where insurance companies are insured.
In ClimatePositions the global climate debt caused by fossil fuel burnings was $2,834 billion in 2010 and the share of the United States was 42.78%, or $1,212 billion. United States has thwarted and rejected a binding global climate agreement for decades.
.
Drawing by Claus Andersen, 2014.
Comments are closed.