Global warming: pre-industrial temperature, baselines, measurements and the 2C limit
2017
194 countries have agreed to hold the increase in the global average temperature to well below 2°C above pre-industrial levels. However, neither “global average temperature” nor “pre-industrial levels” are defined in the agreement. Furthermore, different scientific groups produce different temperature datasets, which are not exactly the same because of differences in the methodologies (and to complete the absurdity, the Paris Agreement contains no binding national emission pathways to the overall goal). The following temperature survey refers to datasets from ‘National Oceanic and Atmospheric Administration (NOAA)‘.
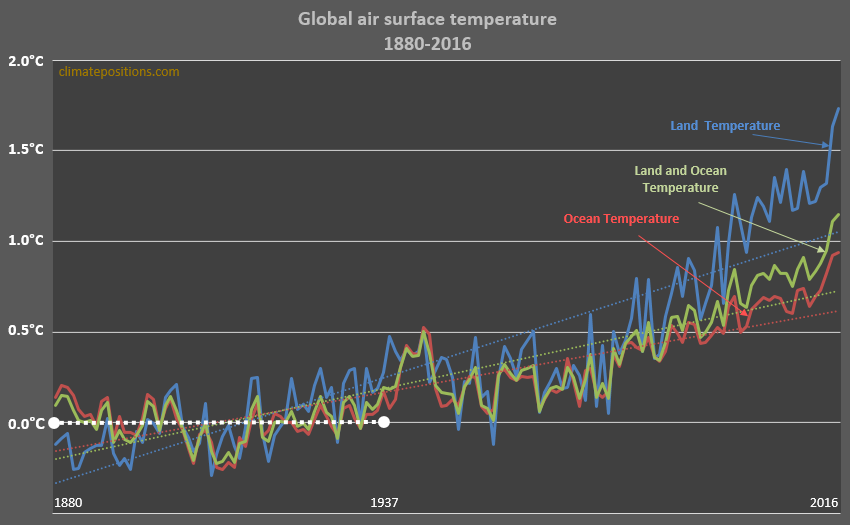
The diagram below shows the global surface (air) temperature 1880-2016 over 1) Land, 2) Ocean and 3) Land/Ocean combined (which is most commonly used). All three baselines are 1880-1937 (set at 0°C) and the dashed lines show the average trends. Apparently, global (air) warming happens considerably faster on land than on oceans. By the way, the global warming in 2016, baseline 1880-1937, was 1.73°C (Land), 0.94°C (Ocean) and 1.15°C (Land/Ocean).
Added 07-02-2017: Soon, the global temperature ‘Indicator’ in ClimatePosition will be changed from Land (air) Temperature (10-years average) to Land/Ocean (air) Temperature (10-years average). The change will not affect the current accumulated Climate Debt of any country, only the future calculation.
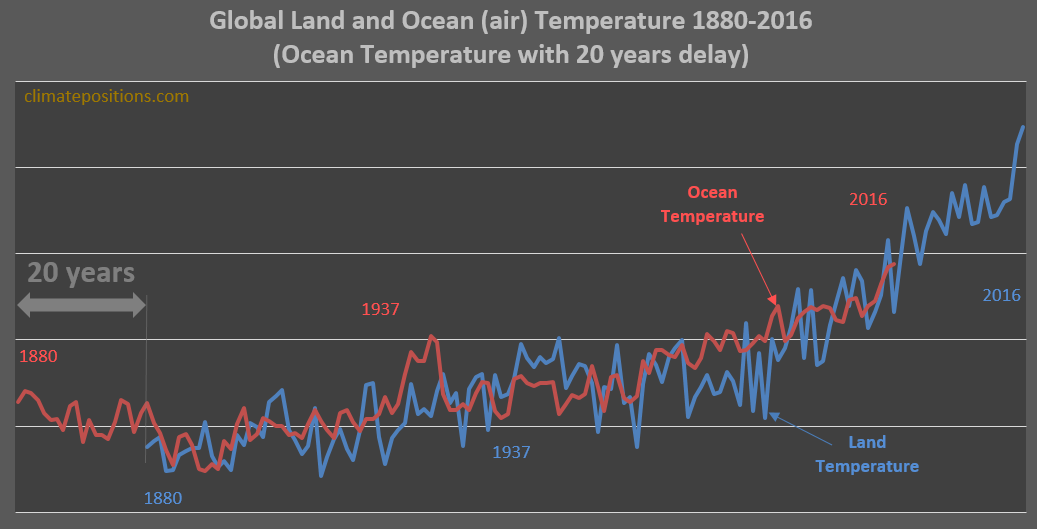
The next diagram shows the Ocean Temperature graph with twenty-years delay compared to the Land Temperature graph. So far, the Land Temperature rise seems to be about twenty years ahead of the Ocean Temperature rise (and fifteen years ahead of the Land/Ocean Temperature graph). If this correlation continues, then the present Land Temperature indicates the Land/Ocean Temperature in about fifteen years, around 2031 (this is of cause not science). Read about Ocean Waters warming at the bottom.
‘The industrial revolution‘ happened between 1760 and 1840. Consequently, pre-industrial times ended around 1760. However, global temperature measurements began nearly a century later, between 1850 and 1880. “Pre-industrial levels” is thus undefined and open for scientific discussions.
A new ‘Study‘ published 2017, suggests that the period 1720-1800 is the most suitable choice of pre-industrial temperature. The study estimates the global average temperature during this period using a range of approaches based on observations, radiative forcing, global climate model simulations and proxy evidence. With great caution the conclusion is that the average global Land/Ocean Temperature 1720-1800 could have been around 0.68°C (±0.125°C) cooler than the period 1986-2005, or around 0.024°C (±0.125°C) cooler than the period 1880-1937 (the latter is calculated by me). In other words, baseline 1880-1937 could very well be close to pre-industrial temperature (and so could baseline 1880-1910).
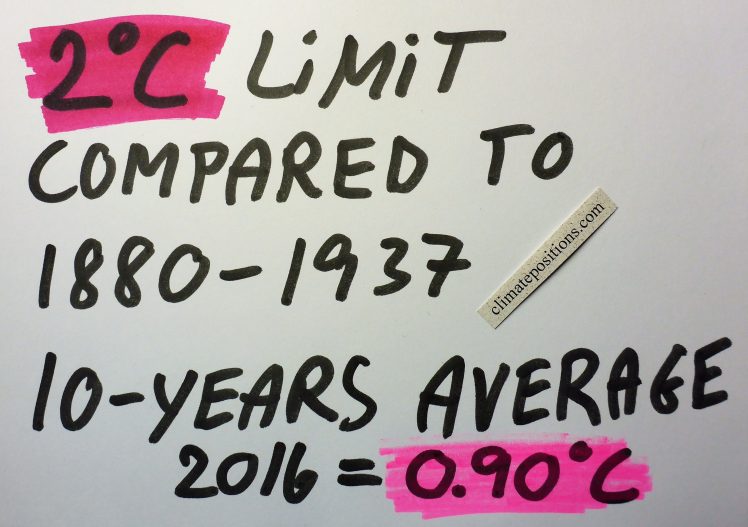
The average global Land/Ocean Temperature in the past decade (2007-2016) was 0.90°C warmer than baseline 1880-1937 (which is close to pre-industrial levels). For comparison, the decade 1992-2001 was 0.63°C warmer than baseline 1880-1937. When reaching 2.0°C warming in this manner, the Paris Agreement has failed catastrophically, one could say.
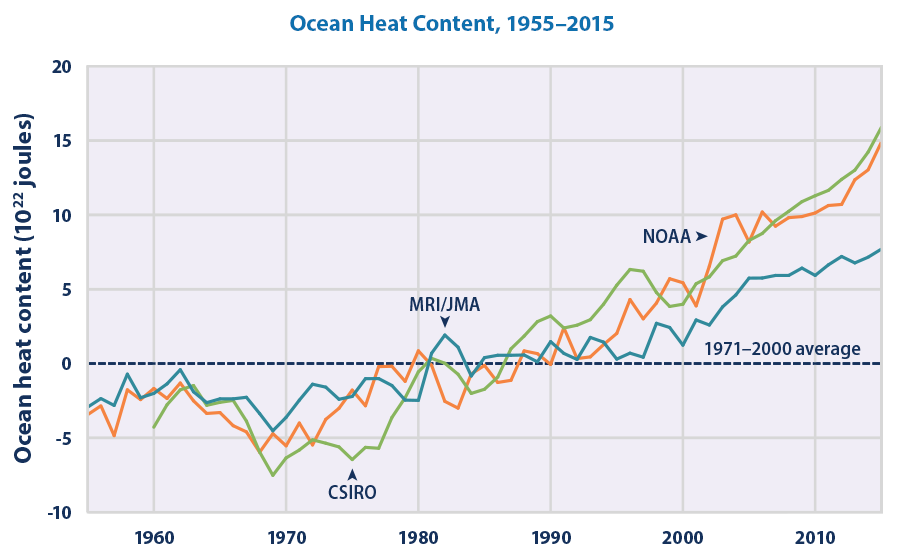
A ‘Paper‘ published in Nature Climate Change in 2016 (read this ‘Article‘ from The Guardian) suggests that the Ocean Waters has absorbed around 90% of the excess heat generated by human consumption of Fossil Fuels. However, half of this increase has occurred in the past two decades. The diagram below shows the warming since 1955.
According to the study, todays temperature in the upper Ocean Waters is close to 0.5°C warmer than pre-industrial times, and that the deep-water temperature has increased by “several tenths of a degree” (meaning at least 0.2°C warmer, obviously with great uncertainty). The scientists found that 35% of the additional warmth, since pre-industrial times, is found at Ocean Waters depths below 700 meters, compared to 20% warmth only twenty years ago.
Finally, the table below lists the current global warming since pre-industrial times, or current 10-years average air temperature rise compared to baseline 1880-1937, in five categories: 1) Deep Ocean Waters, 2) Upper Ocean Waters, 3) Ocean (air) Temperature, 4) Land/Ocean (air) Temperature, and 5) Land (air) Temperature.
| Global warming (2007-2016) | . |
| . | . |
| Deep Ocean Waters | >0.2°C (?) |
| Upper Ocean Waters | 0.5°C |
| Ocean (air, 10-years average) | 0.74°C |
| Land/Ocean (air, 10-years average) | 0.90°C |
| Land (air, 10-years average) | 1.36°C |
.
Data source on global (air) Land and Ocean Temperature: NOAA National Climatic Data Center (links in the menu “Calculations”).
Drawing by Claus Andersen, 2017 (Land/Ocean Temperature 2007-2016 is 0.90°C warmer compared to 1880-1937).
Comments are closed.