Greenhouse gas submissions of the United States, the European Union and Russia, by March 2015

Submissions of 33 countries (including ‘EU-28‘) with “intended nationally determined” greenhouse gas reductions have so far reached the United Nation’s ‘COP process website’. The greenhouse gas reductions proclaimed in the submissions include, besides carbon dioxide (CO2), gases such as methane, nitrous oxide, perfluorocarbons, hydrofluorocarbons, sulphur hexafluoride and nitrogen trifluoride – and changes in land-use and forestry. This mixture of different sources together with different parties, base years and target years, make the intended greenhouse gas reductions both muddy and incomparable between nations. None of the submissions so far include future financing to developing countries.
The following compares the submissions of the United States, the European Union (EU-28) and Russia – combined these 30 countries were responsible of 34% of the global carbon dioxide emissions from fossil fuels in 2012.
In 2013, on the road to COP-21 in Paris in November 2015, the vision of the United States was as follows: All parties should design “their own commitments to be consistent with their circumstances and capabilities.” The submissions should include “clarifying information (…) in a simple format that is easy for a reader to understand.” (read this ‘article’). Indeed, the simplified clarifications do help the reader to understand the overwhelming carefulness for future generations! … While the worst case climate scenario from the first IPCC report in 1992 is materializing.
This is what the United States, the European Union and Russia intends to do:
- The United States will reduce greenhouse gases by at least 26% by 2025 compared to 2005 (and by 17% in 2020).
- The European Union will reduce greenhouse gases by at least 40% by 2030 compared to 1990.
- Russia will reduce greenhouse gases by at least 25% by 2030 compared to 1990.
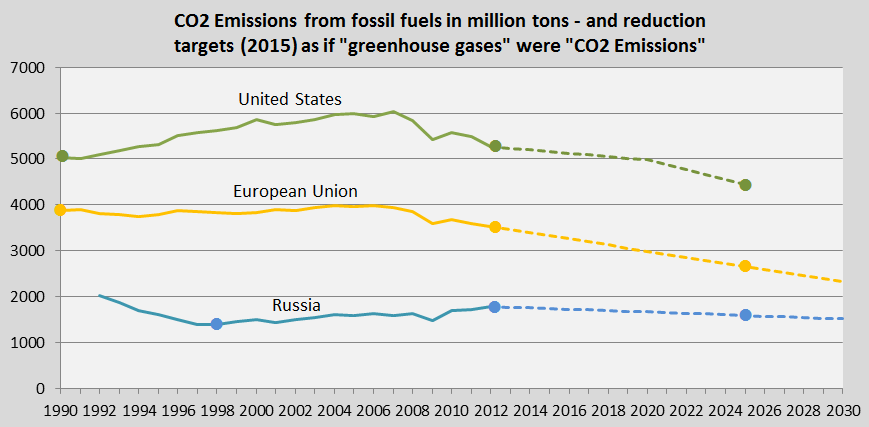
In the United States (as an example) more than 90% of all greenhouse gas emissions come from the combustion of fossil fuels1. Let us as an experiment replace “greenhouse gases” with “CO2 Emissions from fossil fuels” in the submissions; then the reduction targets are clarified in a far more disturbing manner:
- The United States: In 1990 the CO2 Emissions were 5,041 million tons and if a reduction target of 26% by 2025 is effectuated, then the average annual emissions between 1991 and 2025 will be 5,347 million tons, or 6% higher than in 1990 (the per capita CO2 Emissions in 1990 were 20.2 tons).
- The European Union: In 1990 the CO2 Emissions (of the 28 countries) were 3,878 million tons and if a reduction target of 40% by 2030 is effectuated, then the average annual emissions between 1991 and 2025 will be 3,536 million tons, or 9% lower than in 1990 (the average per capita CO2 Emissions in 1990 was 8.1 tons (with huge national differences) – in 2011emissions were 7.1 tons per capita.
- Russia: In 1998 (USSR collapsed in 1991) the CO2 Emissions were 1,384 million tons and if a reduction target of 25% by 2030 is effectuated, then the average annual emissions between 1999 and 2025 will be 1,459 million tons, or 5% higher than in 1998 (the per capita CO2 Emissions in 1998 were 9.3 tons – however, in 1992 emissions were 13.6 tons per capita).
The diagram below visualizes the disturbing picture described above. The dots mark the reference-years in the calculations. If reductions of other greenhouse gases than CO2 from fossil fuels are prioritized, then the stippled lines will turn more horizontal.
All three parties are responsible for immense proportions of the global CO2 Emissions prior to 1990. See this ‘interactive graphics’ from The Guardian showing the world’s top 20 emitters of carbon dioxide (from fossil fuels and cement) in the past, present and future.
In 2014 the content of CO2 (carbon dioxide) in the atmosphere was 12% higher than in 1990 and with the present increase-rate the content will be 20% higher in 2025 than in 1990.
¹Source: ‘Wikipedia‘.
The current Climate Debts per capita in ClimatePositions of the three parties are as follows: the United States $6,168, the European Union $1,338 (excluding Luxembourg and Malta due to lack of data) and Russia $1,410 (see the ‘ranking’). The total share of the global Climate Debt is 54% (see the ‘ranking’).
.
Source on CO2 Emissions: EIA, U.S. Energy Information Administration and data on preliminary national CO2 Emissions are from Global Carbon Project (links in the menu “Calculations”).
COP submissions since March 2015: ‘INDC submission portal’.
Source on CO2 Content in the atmosphere: NOAA Earth System Research Laboratory (links in the menu “Calculations”).
Photo of sky with text by Claus Andersen, 2015.
Comments are closed.