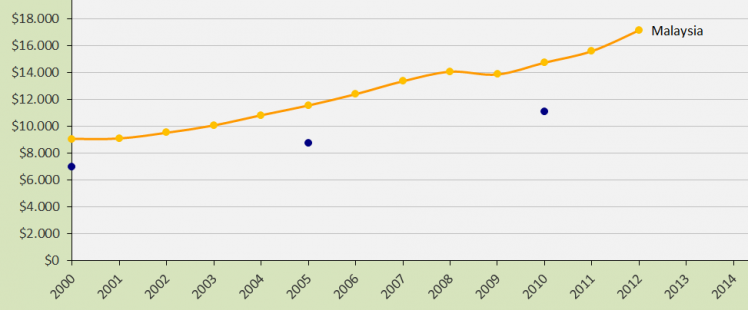
GDP growth rate in Malaysia

2013
The GDP(ppp-$) growth rate in Malaysia is higher than the global average, as illustrated in the diagram 2000-2012. Subject to modifications in the data source. The blue dots shows the global GDP(ppp-$) in 2000, 2005 and 2010. The increase in Malaysia’s prosperity causes a corresponding, but delayed, increase in the Climate Contribution (climate debt) in ClimatePositions. In 2010 Malaysia was the 38th worst performing country.
Roughly speaking the GDP indicator (GDP+) in the calculation is approximately five years delayed compared with the current GDP (in the calculation the annual GDP since 2000 counts with decreasing weight in the past). The general idea is that economic growth must be utilized to sustainable development, but this process takes a few years.
A hypothetical excample: If Malaysia’s GDP(ppp-$) per capita had been 10% lower in 2000-2010, the Climate Contribution per capita in 2010 would also have been 10% lower.
Information on national GDP(ppp-$) per capita is from Worldbank (links in the menu “Calculations”).
Comments are closed.