Indicator update: Per capita CO2 Emissions 2015, by country (preliminary)
2016
‘Carbon Dioxide Information Analysis Center (CDIAC)‘, or simply Global Carbon Project, has published preliminary¹ national carbon emissions, from Fossil Fuels and cement, in 2015. The total national carbon emissions are converted to per capita carbon dioxide emissions (tons of CO2 Emissions) by multiplying by 3.664 and then divide by Population (sourced ‘World Bank‘).
The table below shows the per capita CO2 Emissions from Fossil Fuels (without bunkers) and cement, in tons, in 2012, 2013, 2014 and 2015 of all 97 countries with Climate Debt in ClimatePositions, after the key indicator update (see the ‘Ranking‘). Updates of 199 countries are available in the menu ‘Calculation (Excel)‘. Note that emissions in 2014 and 2015 are preliminary estimates.
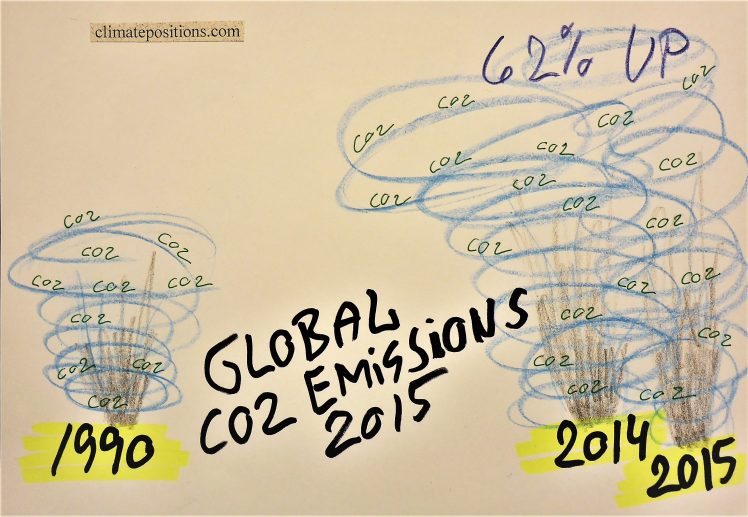
Globally, CO2 Emissions from Fossil Fuels (without bunkers) and cement increased by 0.06% in 2015 compared to 2014, while per capita emissions decreased by 1.11% (4.76 tons in 2015 and 4.82 tons in 2014). Current emissions are 62% above the level of 1990.
| . | . | 2012 | 2013 | 2014 | 2015 |
| . | . | . | . | . | . |
| 1. | Qatar | 46.7 | 40.4 | 37.2 | 40.6 |
| 2. | Trinidad and Tobago | 33.8 | 34.5 | 33.9 | 33.3 |
| 3. | Kuwait | 29.6 | 27.2 | 26.1 | 26.1 |
| 4. | Bahrain | 21.8 | 23.7 | 22.9 | 24.1 |
| 5. | Brunei | 23.8 | 18.9 | 20.6 | 21.6 |
| 6. | United Arab Emirates | 19.2 | 18.7 | 18.7 | 19.3 |
| 7. | Saudi Arabia | 19.2 | 17.9 | 18.6 | 19.0 |
| 8. | Luxembourg | 20.1 | 18.7 | 18.3 | 18.1 |
| 9. | Turkmenistan | 12.6 | 12.8 | 14.5 | 16.9 |
| 10. | Australia | 16.5 | 16.3 | 16.0 | 16.1 |
| 11. | United States | 16.3 | 16.4 | 16.4 | 15.8 |
| 12. | Mongolia | 11.6 | 14.5 | 15.2 | 15.3 |
| 13. | Kazakhstan | 14.6 | 15.4 | 15.5 | 15.0 |
| 14. | Estonia | 13.3 | 15.1 | 14.2 | 15.0 |
| 15. | Oman | 16.7 | 15.6 | 14.1 | 14.1 |
| 16. | Canada | 13.8 | 13.5 | 13.4 | 12.9 |
| 17. | Russia | 12.8 | 12.5 | 12.4 | 12.0 |
| 18. | South Korea | 11.7 | 11.8 | 11.7 | 11.7 |
| 19. | Norway | 9.9 | 11.7 | 11.3 | 11.3 |
| 20. | Netherlands | 10.1 | 10.1 | 9.5 | 9.7 |
| 21. | Japan | 9.6 | 9.8 | 9.5 | 9.3 |
| 22. | Czech Republic | 9.6 | 9.4 | 9.1 | 9.1 |
| 23. | Germany | 9.2 | 9.4 | 8.8 | 8.8 |
| 24. | Libya | 8.3 | 8.1 | 8.3 | 8.6 |
| 25. | Israel | 9.5 | 8.8 | 8.4 | 8.6 |
| 26. | South Africa | 9.0 | 8.9 | 8.9 | 8.4 |
| 27. | Bahamas | 5.1 | 8.2 | 8.3 | 8.4 |
| 28. | Malaysia | 7.5 | 8.0 | 8.0 | 8.2 |
| 29. | Iran | 8.4 | 8.0 | 8.2 | 8.2 |
| 30. | Belgium | 8.3 | 8.4 | 7.9 | 8.2 |
| 31. | Poland | 7.9 | 7.9 | 7.5 | 7.7 |
| 32. | Ireland | 7.8 | 7.6 | 7.5 | 7.6 |
| 33. | Equatorial Guinea | 7.5 | 6.8 | 7.1 | 7.6 |
| 34. | New Zealand | 7.8 | 7.6 | 7.7 | 7.6 |
| 35. | China | 7.4 | 7.5 | 7.5 | 7.5 |
| 36. | Austria | 7.4 | 7.4 | 7.0 | 7.1 |
| 37. | Finland | 9.0 | 8.5 | 7.8 | 7.0 |
| 38. | Slovenia | 7.3 | 7.0 | 6.8 | 7.0 |
| 39. | Belarus | 6.7 | 6.7 | 6.8 | 6.4 |
| 40. | Serbia | 6.1 | 6.3 | 6.0 | 6.3 |
| 41. | Bulgaria | 6.1 | 5.4 | 5.8 | 6.2 |
| 42. | United Kingdom | 7.3 | 7.1 | 6.4 | 6.1 |
| 43. | Greece | 7.2 | 6.3 | 6.0 | 5.9 |
| 44. | Slovakia | 6.1 | 6.2 | 5.7 | 5.8 |
| 45. | Bosnia and Herz. | 5.8 | 5.7 | 5.4 | 5.7 |
| 46. | Denmark | 6.5 | 6.8 | 6.2 | 5.7 |
| 47. | Venezuela | 6.6 | 6.1 | 5.9 | 5.6 |
| 48. | Italy | 6.2 | 5.7 | 5.2 | 5.5 |
| 49. | Spain | 5.7 | 5.1 | 5.0 | 5.3 |
| 50. | Barbados | 5.2 | 5.1 | 5.2 | 5.3 |
| 51. | Cyprus | 6.1 | 5.2 | 5.2 | 5.2 |
| 52. | Portugal | 4.4 | 4.4 | 4.4 | 4.7 |
| 53. | Iraq | 4.7 | 5.0 | 4.9 | 4.7 |
| 54. | Thailand | 4.5 | 4.5 | 4.6 | 4.6 |
| 55. | France | 5.1 | 5.0 | 4.5 | 4.6 |
| 56. | Turkey | 4.4 | 4.3 | 4.7 | 4.5 |
| 57. | Chile | 4.7 | 4.7 | 4,6 | 4,5 |
| 58. | Switzerland | 4,7 | 5,0 | 4.4 | 4.5 |
| 59. | Hungary | 4.5 | 4.2 | 4.2 | 4.4 |
| 60. | Sweden | 4.9 | 4.6 | 4.5 | 4.4 |
| 61. | Croatia | 4.3 | 4.2 | 4.1 | 4.2 |
| 62. | Lithuania | 4.6 | 4.3 | 4.1 | 4.2 |
| 63. | Ukraine | 6.5 | 6.0 | 5.1 | 4.2 |
| 64. | Suriname | 4.7 | 3.9 | 4.0 | 4.0 |
| 65. | Macedonia | 4.3 | 4.0 | 3.8 | 4.0 |
| 66. | Lebanon | 5.1 | 5.0 | 5.1 | 4.0 |
| 67. | Algeria | 3.5 | 3.5 | 3.7 | 3.8 |
| 68. | Mexico | 3.9 | 3.9 | 3.8 | 3.7 |
| 69. | Romania | 4.1 | 3.5 | 3.5 | 3.6 |
| 70. | Montenegro | 3.8 | 3.6 | 3.5 | 3.6 |
| 71. | Uzbekistan | 3.9 | 3.4 | 3.5 | 3.5 |
| 72. | Mauritius | 3.2 | 3.0 | 3.4 | 3.4 |
| 73. | Jordan | 3.9 | 3.8 | 3.9 | 3.4 |
| 74. | Jamaica | 2.7 | 2.8 | 2.9 | 3.0 |
| 75. | Gabon | 2.8 | 2.9 | 2.9 | 2.9 |
| 76. | Tunisia | 2.5 | 2.5 | 2.7 | 2.8 |
| 77. | Panama | 2.7 | 2.7 | 2.8 | 2.8 |
| 78. | Ecuador | 2.6 | 2.8 | 2.8 | 2.7 |
| 79. | Botswana | 2.1 | 2.5 | 2.8 | 2.7 |
| 80. | Guyana | 2.6 | 2.5 | 2.6 | 2.6 |
| 81. | Brazil | 2.3 | 2.5 | 2.6 | 2.5 |
| 82. | Egypt | 2.5 | 2.4 | 2.4 | 2.4 |
| 83. | Uruguay | 2.6 | 2.2 | 2.3 | 2.3 |
| 84. | Dominican Republic | 2.2 | 2.1 | 2.2 | 2.2 |
| 85. | Indonesia | 2.4 | 1.9 | 2.0 | 2.1 |
| 86. | Fiji | 1.8 | 1.9 | 2.1 | 2.1 |
| 87. | Vietnam | 1.8 | 1.7 | 1.9 | 2.0 |
| 88. | Peru | 1.8 | 1.9 | 1.9 | 1.9 |
| 89. | Bolivia | 1.8 | 1.9 | 1.9 | 1.9 |
| 90. | Armenia | 1.9 | 1.8 | 1.8 | 1.9 |
| 91. | Morocco | 1.9 | 1.7 | 1.8 | 1.8 |
| 92. | India | 1.6 | 1.6 | 1.7 | 1.7 |
| 93. | Albania | 1.6 | 1.7 | 1.7 | 1.7 |
| 94. | Angola | 1.5 | 1.4 | 1.3 | 1.3 |
| 95. | Honduras | 1.2 | 1.2 | 1.2 | 1.2 |
| 96. | Guatemala | 0.8 | 0.9 | 0.9 | 0.9 |
| 97. | Papua New Guinea | 0.7 | 0.8 | 0.9 | 0.9 |
.
¹Global Carbon Budget’s preliminary emission estimates are based on BP’s Energy Review of the World.
.
Source on national CO2 Emissions is from ‘Carbon Dioxide Information Analysis Center (CDIAC)‘. Population is from ‘World Bank‘.
Drawing by Claus Andersen, 2016.
Comments are closed.