IPCC Report: Limiting Global Warming to 1.5ºC requires 45% CO2 reductions by 2030 compared to 2010 – and zero emissions by 2050 (but which countries are to reduce how much per capita?)
2018
The IPCC Report ‘Global Warming of 1.5°C‘ released October 2018, finds that limiting global warming to 1.5°C would require reductions of global human-caused CO2 Emissions (carbon dioxide) of 45% by 2030 compared to 2010, and reach zero emissions around 2050¹.
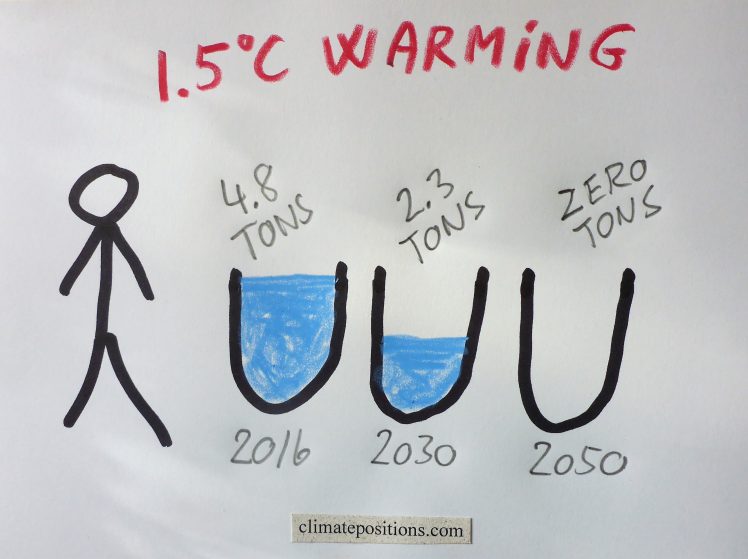
However, since global Fossil CO2 Emissions increased 6.4% between 2010 and 2016, and the world population is expected to grow 1.2% annually the years to come, the required 45% global CO2 reductions by 2030, is equivalent to 53% reduction per capita by 2030 compared to 2016, or in only 14 years. In other words, an average world citizen must cut Fossil CO2 Emissions from 4.8 tons in 2016 to around 2.3 tons by 2030 and zero by 2050 (if limiting global warming to 1.5°C). Note that forest cover growth, removing CO2 from the air, etc. can substitute Fossil CO2 reductions in the IPCC scenarios².
The required drastic 53% per capita CO2 reductions by 2030 of an average world citizen, should be perceived in the light of the fact that one fifth of the world’s population live in countries emitting less than one ton annually and that another fifth live in poor countries³ emitting more than one ton annually. Consequently, the per capita reductions will have to be considerably larger than 53% among the remaining countries.
The diagram below shows global Fossil CO2 Emissions per capita 2000-2016 (black graph) and IPCCs 1.5°C scenario 2017-2030-2050 (black stippled graph).
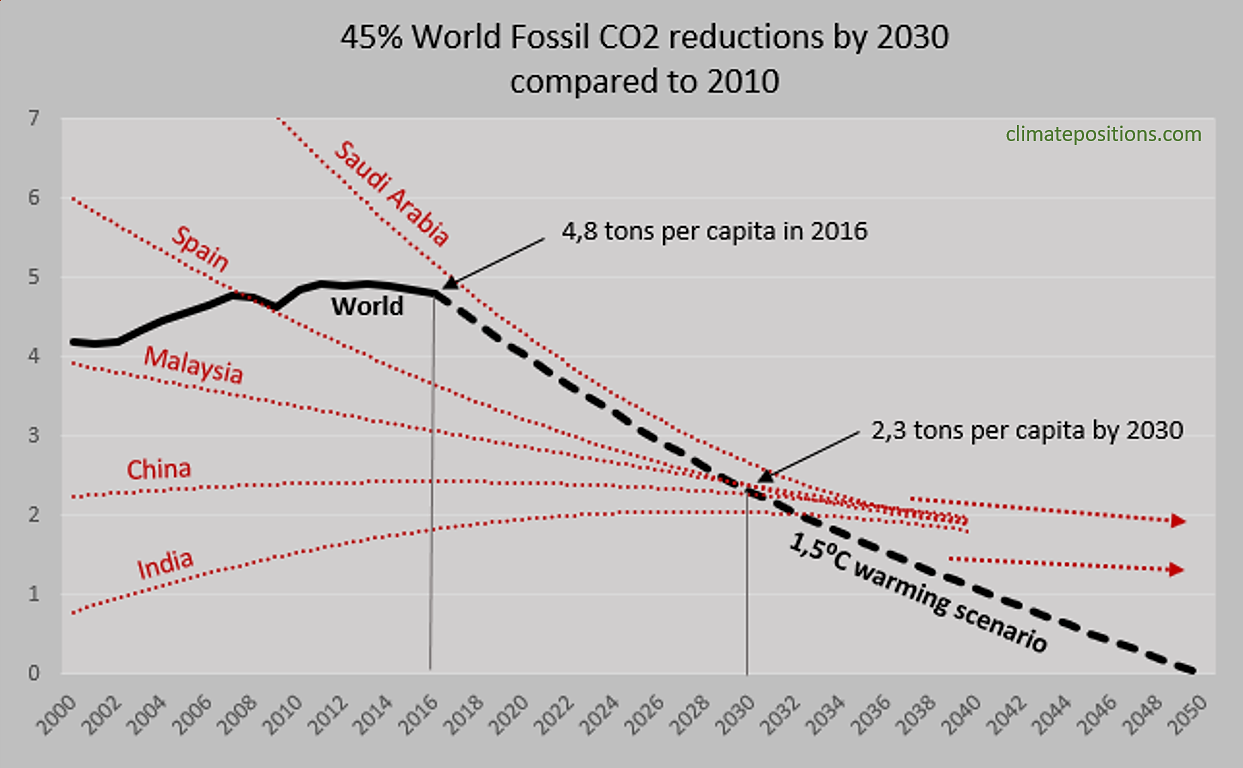
The approximate Climate Debt Free Fossil CO2 Emissions reduction-lines (red) of Saudi Arabia, Spain, Malaysia, China and India in ClimatePositions, are shown in the diagram for comparison. Since the future ‘Indicator-values‘ are unknown, the national reduction-lines are more illustrative than accurate. Note that ClimatePositions allows emissions of about 1.5 tons per capita on average passed 2050, whereas the IPCC Report requires net zero emissions by 2050.
The table below shows some key figures of the five countries from the diagram. The table is read as follows: The per capita Fossil CO2 Emissions of Saudi Arabia was 11.37 tons in the 1990s and 16.01 tons in 2016; the average excess was 5.78 tons annually between 2000 and 2016, and the price per ton emitted in total was $34.41.
| . | Per capita Fossil | Per capita Fossil | Exceeded per | Price per |
| . | CO2 Emissions | CO2 Emissions | capita 2000-2016 | ton emitted |
| . | 1990s, tons | 2016, tons | tons, annually | 2000-2016 |
| . | . | . | . | . |
| Saudi Arabia | 11.4 | 16.0 | 5.8 | $34.41 |
| Spain | 6.2 | 5.4 | 1.5 | $12.82 |
| Malaysia | 4.2 | 8.5 | 3.0 | $17.33 |
| China | 2.4 | 7.5 | 2.7 | $9.82 |
| India | 0.9 | 1.9 | 0.0 | $0.01 |
.
¹The IPCC Summary for Policymakers: “In model pathways with no or limited overshoot of 1.5°C, global net anthropogenic CO2 emissions decline by about 45% from 2010 levels by 2030 (40–60% interquartile range), reaching net zero around 2050 (2045–2055 interquartile range). For limiting global warming to below 2°C CO2 emissions are projected to decline by about 20% by 2030 in most pathways (10–30% interquartile range) and reach net zero around 2075 (2065–2080 interquartile range)”.
²The IPCC Summary for Policymakers: “The report finds that limiting global warming to 1.5°C would require “rapid and far-reaching” transitions in land, energy, industry, buildings, transport, and cities. Global net human-caused emissions of carbon dioxide (CO2) would need to fall by about 45 percent from 2010 levels by 2030, reaching ‘net zero’ around 2050. This means that any remaining emissions would need to be balanced by removing CO2 from the air”.
³”Poor countries” defined as countries with GDP(ppp) less than $7,000 in 2016 (World average is more than $16,000).
.
‘IPCC Special Report on Global Warming of 1.5ºC‘, ‘Summary for Policymakers‘ and ‘Headline Statements‘.
Guardian, Oct. 2018: ‘We have 12 years to limit climate change catastrophe, warns UN‘.
ClimatePositions, May 2017: ‘Carbon Brief: Global Carbon Budget and CO2 Emission scenarios (50% risk of 1.5C, 2.0C and 3.0C warming)‘.
Updated data and diagrams of all ‘Indicators‘ and all countries in ClimatePositions are available in the menu ‘Calculations (Excel)‘.
Data on Fossil CO2 Emissions (excluding international shipping and aviation) including industrial processes (cement, steel, liming, etc.) are from EDGAR (European Commission) (links in the menu Calculations / Sources & Links).
Drawing by Claus Andersen, 2018.
Comments are closed.