Miserable climate performance of Netherlands, Belgium and Luxembourg

2014
Netherlands and Belgium are rich countries and the little tax haven Luxembourg is extremely rich – see the diagram with the GDP(ppp) since 2000 compared with the world average. Netherlands and Belgium were 9th and 10th worst performing countries out of 145 in Climate Positions 2010. See the full ranking in the menu “Contributions / Per Capita US$ Rank”. Due to lack of data on Ecological Footprint Luxembourg is not included in the ranking. However, if the missing data is estimated at the same level as the neighboring countries, then Luxembourg would be 4th on the list. Together, the three countries are the vanguard of climate destruction in the European Union (EU).
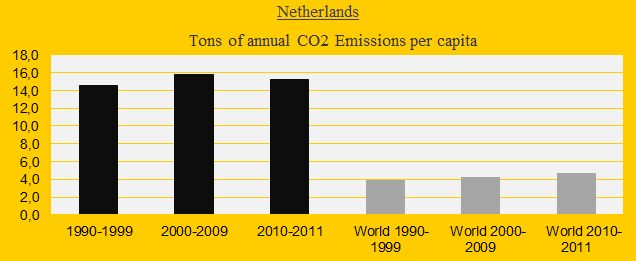
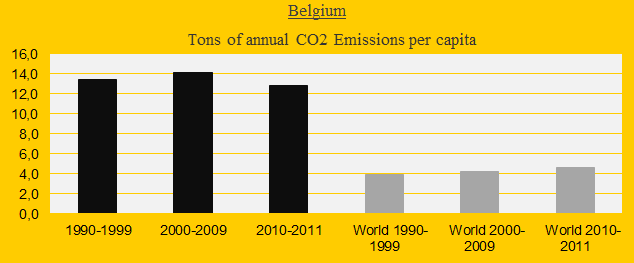
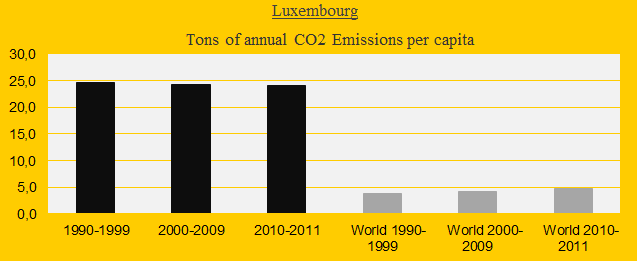
The three diagrams below show the CO2 Emissions (carbon dioxide) in decades of Netherlands, Belgium and Luxembourg in comparison with the global average.
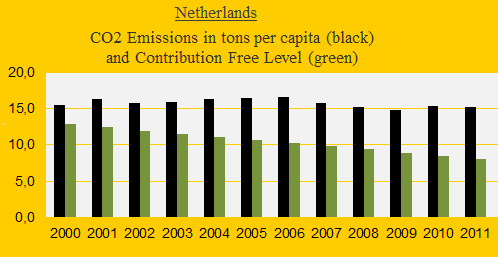
Netherlands annual CO2 Emissions since 2000 illustrate the misery (see the diagram below): The gap between the Contribution Free levels (the green bars) and the emitted levels keep increasing – so does the climate debt. In the most recent calculation, the Climate Contribution amounts to $3,997 per capita
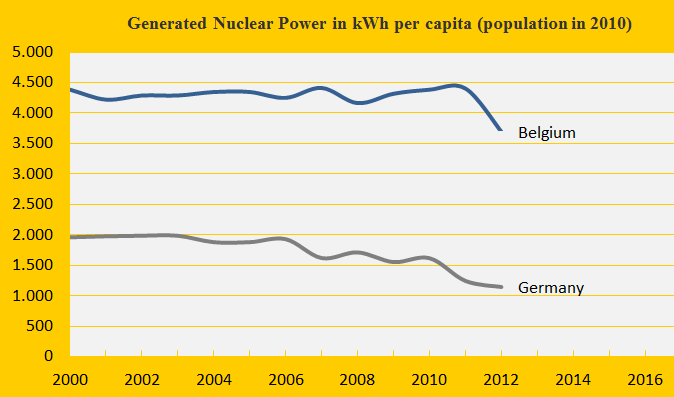
Belgium has the world’s 3rd largest Nuclear Power generation per capita and 8.3% of the national Climate Contribution (debt) is caused by the lack of Nuclear phase-out since the 1990s. The diagram below shows the development since 2000 in comparison with Germany. The Nuclear Power generation in Netherlands is only causing 0.3% of the Climate Contribution. Dangerous, radioactive waste from Nuclear Power plants will burden future generations for thousands of years. Because of this, Nuclear Power is not considered a solution to climate change in ClimatePositions.
A hypothetical example: If the performance of Netherlands applied to all countries the Climate Contribution worldwide would be around ten times larger than the present.
Information on national GDP(ppp-$) per capita: Worldbank (links in the menu “Calculations”). Read about GDP+ in the submenu ”Indicators”.
Source on CO2 Emissions: EIA, U.S. Energy Information Administration (links in the menu “Calculations”).
Data on national Nuclear Power generation: World Nuclear Association (links in the menu “Calculations”).
Comments are closed.