Mongolia and other coal producing countries (the thirteen most coal-dependent countries)

2015
Mongolia is the world’s second largest coal producer per capita (Btu, 2011) and coal is the world’s no. 1 carbon dioxide emitter. However, the flawed democracy (surrounded by the giant authoritarian regimes of China and Russia) is Contribution Free (no Climate Debt) in ClimatePositions – how is this possible?
The table below ranks the thirteen largest per capita coal producers (Btu, 2011), with the world average set at 1.0. The Mongolian coal production is almost ten times larger than the world average. For comparison, the table shows per capita values of CO2 Emissions (from fossil fuels), GDP(ppp-$) and Climate Debt. More comments below the table.
_________________________________________
| . | Coal producing | Coal prod. | CO2 Emission | GDP(ppp-$) | Climate Debt |
| . | countries | per capita | per capita | per capita | per capita |
| . | . | (Btu¹, 2011) | (tons, 2012) | (2013) | (update 2015) |
| . | . | . | . | . | . |
| 1. | Australia | 19.0 | 19.1 | $43,550 | $7,473 |
| 2. | Mongolia | 9.8 | 3.6 | $9,433 | Free |
| 3. | Kazakhstan | 5.6 | 12.8 | $23,206 | $1,384 |
| 4. | South Africa | 5.5 | 9.7 | $12,504 | $894 |
| 5. | United States | 3.2 | 16.8 | $53,143 | $6,379 |
| 6. | Czech Republic | 3.0 | 9.0 | $27,344 | $1,132 |
| 7. | Poland | 2.7 | 7.5 | $23,275 | $516 |
| 8. | Bosnia and Herz. | 2.4 | 5.6 | $9,632 | $432 |
| 9. | China | 2.4 | 6.4 | $11,904 | $417 |
| 10. | Colombia | 2.4 | 1.7 | $12,371 | Free |
| 11. | Serbia | 2.3 | 5.7 | $12,374 | $508 |
| 12. | Russia | 2.2 | 12.9 | $24,120 | $1,460 |
| 13. | Canada | 2.1 | 16.1 | $43,207 | $5,302 |
| . | World average | 1.0¹ | 4.7 | $14,301 | $769 (2014) |
.
¹World average coal production (Btu, 2011) per capita is set at 1.0.
_________________________________________
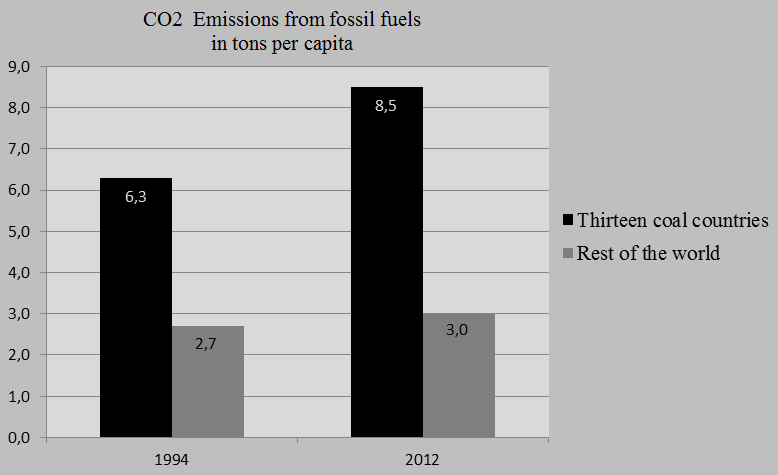
The thirteen countries combined produced 81% of the world’s coal in 2011² (Btu). CO2 Emissions from fossil fuels of the thirteen countries has increased by 50% since 1994, compared to 47% for the rest of the world. The difference in per capita CO2 Emissions of the two country groups, however, is even more pronounced – see the diagram below (coal is indeed a climate change monster).
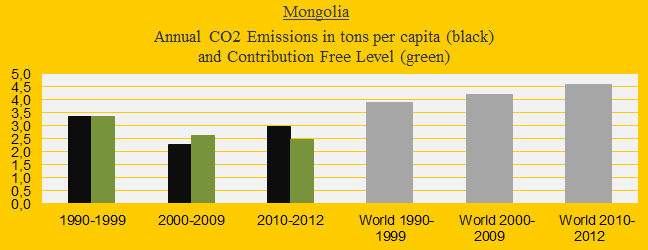
Mongolia and the neighboring countries of China, Russia and Kazakhstan were responsible of 52% of the world’s coal production in 2011 and 31% of the world’s CO2 Emissions from fossil fuels. Mongolia’s CO2 Emissions per capita in decades are shown in the diagram below. An impressive decrease in the first decade of the new millennium has regrettably been followed by a significant increase. The shifting trend is mainly driven by coal consumption.
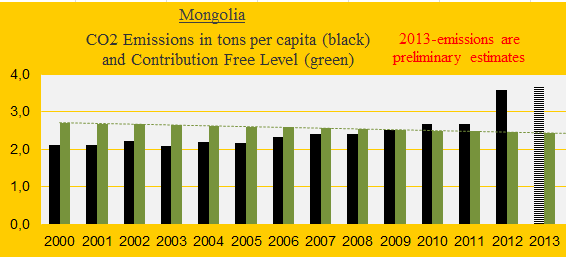
Until 2009, the Mongolian CO2 Emissions per capita was below the Contribution Free Level (the green bars in the diagram below). Emissions increased dramatically in 2012 and if the high level continues in 2013 (as estimated) and 2014 the country will have a Climate Debt of a few US$ per capita (depending on other ‘indicators’ in ClimatePositions). The reason why Mongolia, in spite of a huge per capita coal production, has no Climate Debt so far is that only domestic consumption of fossil fuels counts, not export.
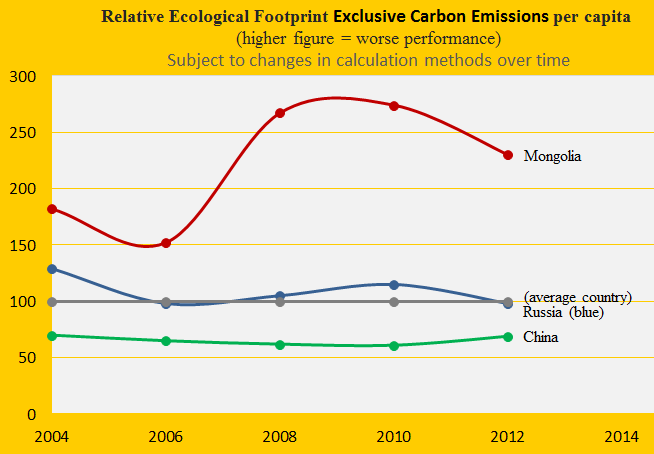
Surprisingly, the Ecological Footprint (without carbon) of Mongolia is the fourth largest in the world. The diagram below shows the footprint since 2004 in comparison with China, Russia and the world average. The large footprint of Mongolia is due to grazing and livestock (most herders follow a pattern of nomadic or semi-nomadic pastoralism).
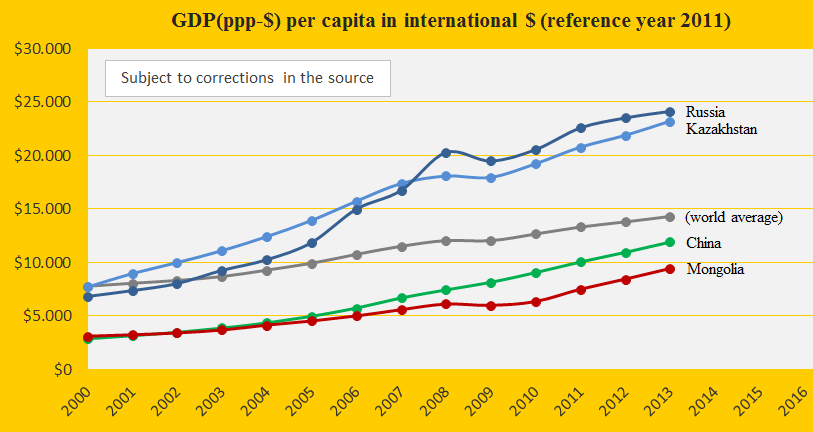
The last diagram shows the GDP(ppp-$) per capita of Mongolia, China, Russia, Kazakhstan and the world average. The four countries have the same order as for per capita CO2 Emissions and Climate Debt.
Read the article ‘Divestment from fossil fuels‘ (with a ranking of the one hundred largest public coal companies).
²The world’s largest coal producers are (Btu, 2011): 1. China (45.5%), 2. United States (14.6%), 3. India (6.8%), 4. Indonesia (6.1%), 5. Australia (6.0%), 6. Russia (4.5%), 7. South Africa (3.9%), 8. Colombia (1.5%), 9. Poland (1.5%) and 10. Kazakhstan (1.4%). The Mongolian share is (0.4%).
Source on CO2 Emissions: EIA, U.S. Energy Information Administration and data on preliminary national CO2 Emissions are from Global Carbon Project (links in the menu “Calculations”).
Source on Ecological Footprint: WWF reports “The Living Planet” published 2006-2014 (links in the menu “Calculations”).
Information on national GDP(ppp-$) per capita: Worldbank (links in the menu “Calculations”).
Source on coal production is from EIA, U.S. Energy Information: http://www.eia.gov/cfapps/ipdbproject/iedindex3.cfm?tid=1&pid=7&aid=1&cid=regions&syid=1990&eyid=2012&unit=QBTU.
Drawing by Claus Andersen, 2015.
Comments are closed.