Nigeria – per capita Fossil CO2 Emissions (zero Climate Debt)
2020
Although Nigeria’s accumulated Climate Debt is zero, the populous country is the world’s 38th largest emitter of Fossil CO2.
The following diagrams expose the trends of Fossil CO2 Emissions, GDP(ppp-$), Environmental Performance, Forest Cover and Primary Forest.
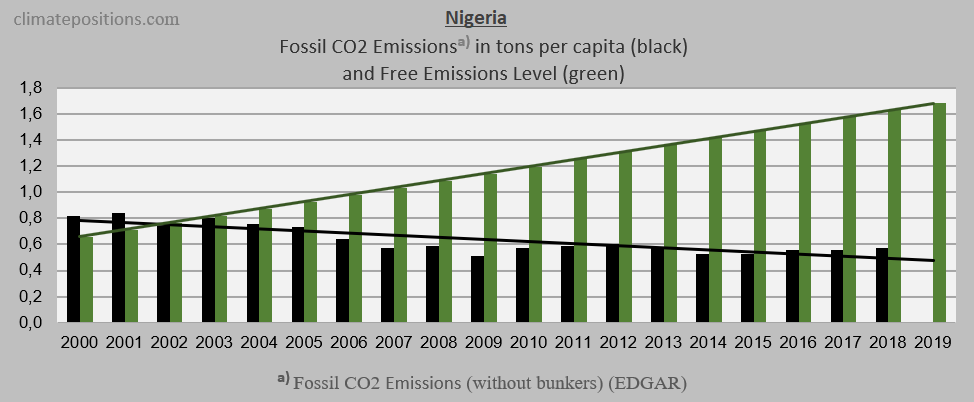
The first diagram shows the Fossil CO2 Emissions per capita annually between 2000 and 2018. The green bars show the Free Emissions Level. Nigeria is far from having Climate Debt.
Once Nigeria’s enters the next 20-year period (ClimatePositions 2020-2039) most of the emissions gap between the free green line and the black line (the unused Free Fossil CO2 Emissions) will no longer be available for free. In other words, any country’s unused Free Fossil CO2 Emissions will basically be deleted at the end of the 20-year period. The 20-year calculation will be completed when Fossil CO2 Emissions 2019 are released.
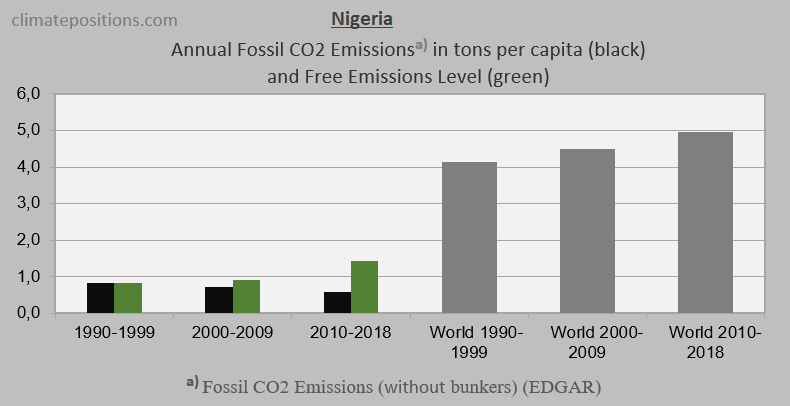
The second diagram shows Fossil CO2 Emissions in tons per capita in decades. Again, the green bars show the Free Emission Level. The grey bars are World Fossil CO2 Emissions average.
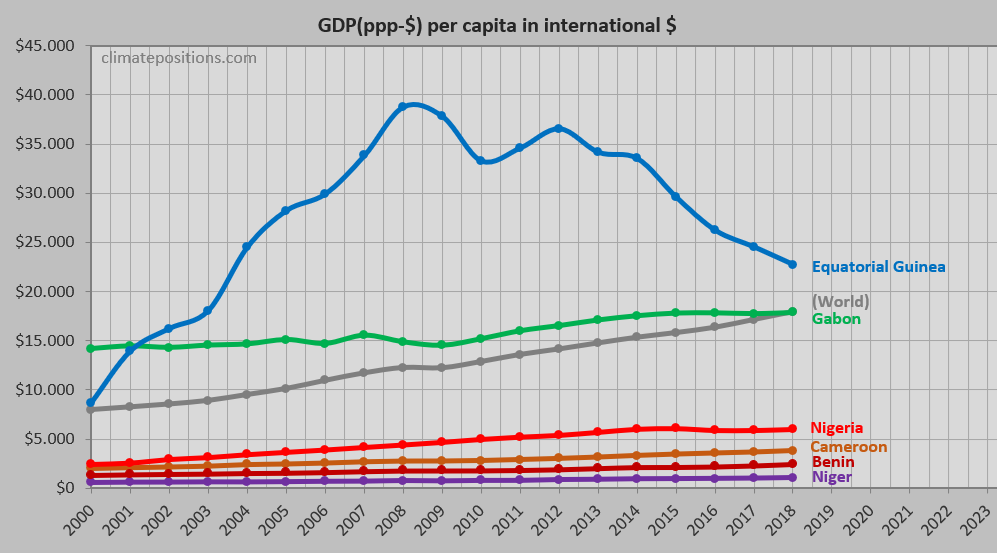
The third diagram shows per capita GDP(ppp-$) of Nigeria, Gabon, Equatorial Guinea, Cameroon, Niger and Benin.
The next diagram shows the relative Environmental Performance of Nigeria, Gabon and Equatorial Guinea, with an average country among 182 set at 100. Note that data is three years prior to the specified years.

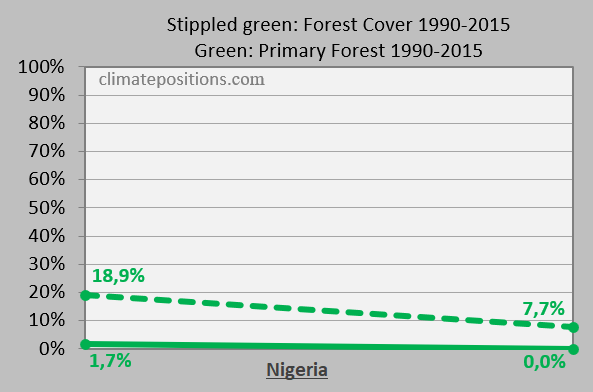
The final diagram shows the changes in Forest Cover and Primary Forest between 1990 and 2015. Global updates are expected in 2020.
.
Updated data and diagrams of all ‘Indicators‘ and countries in ClimatePositions are available in the sub-menu ‘Calculations (Excel)‘.
Data on Fossil CO2 Emissions (excluding international shipping and aviation) including industrial processes (cement, steel, liming, etc.) are from EDGAR (European Commission) (links in the menu Calculations / Sources & Links). Direct link ‘here‘.
Information on national GDP(ppp-$) per capita: Worldbank (links in the menu Calculations / Sources & Links).
Source on Environmental Performance: Yale and Columbia University (links in the menu Calculations / Sources & Links).
Forest Data on national Forest Cover and Primary Forests are from United Nations UN (Report: Global Forest Resources Assessments) (links in the menu Calculations / Sources & Links).
Drawing/illustration by Claus Andersen, 2020.
Comments are closed.