Nuclear Power countries fail on climate responsibility
2013
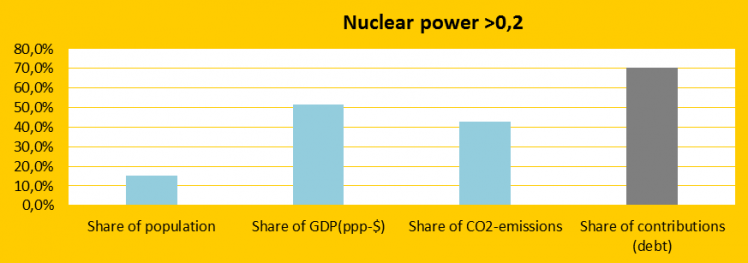
Seen as a group the top twenty Nuclear Power generating countries (kWh per capita) perform miserable on the climate change challenge. The diagram shows the twenty countries’ total share of the global: 1) Population (15.4%), 2) GDP(ppp-$) (51.5%), 3) CO2 emissions (42.9%) and 4) Contributions (70.6%). The nuclear power counts in calculations of the national Contributions (climate debt) as if the energy was produced with oil.
Below the twenty Nuclear Power countries are ranked in Nuclear Power generation per capita 2000-2012. The ranking on the list of the worst performing countries (with 145 countries in ClimatePositions 2010) is shown in brackets. Taiwan is excluded because of lack of indicator data.
- Sweden (30)
- France (26)
- Belgium (10)
- Finland (16)
- Switzerland (32)
- Slovakia (41)
- South Korea (15)
- Slovenia (25)
- United States (7)
- Canada (8)
- Bulgaria (48)
- Lithuania (65)
- Czech Republic (29)
- Japan (18)
- Ukraine (60)
- Germany (24)
- Hungary (47)
- Spain (23)
- United Kingdom (27)
- Russia (31)
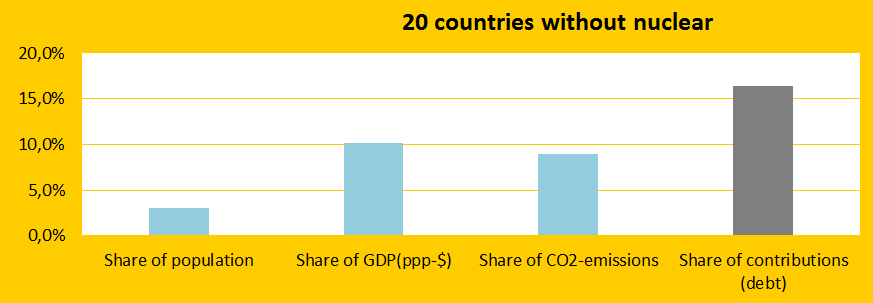
The top ten countries on the list above are on average positioned 16 numbers higher on the list of worst performing countries than the bottom ten. Nuclear Power seems to correspond better with national cynicism than global sustainable development. To emphasize this statement the diagram below shows the global share of twenty countries without Nuclear Power – countries with the same average GDP(ppp-$) per capita as the twenty Nuclear Power countries. The share trends in the two country groups are very similar, indicating that Nuclear Power doesn’t seem to reduce CO2 Emissions or Contributions significantly. Read an article about the radioactive nuclear waste to deal with for future generations ‘here’.
Data on national nuclear power generation is from: World Nuclear Association (links in the menu “Calculations”).
Source on CO2 emissions: EIA, U.S. Energy Information Administration (links in the menu “Calculations”).
Information on national GDP(ppp-$) per capita is from Worldbank (links in the menu “Calculations”). Read about GDP+ in the submenu ”Indicators”.
Data on national and global populations are from the EIA, U.S. Energy Information Administration (links in the menu “Calculations”).
Comments are closed.