Putin’s Russia is deteriorating ecologically

2013
Russia was the world’s third largest CO2 Emitter (carbon dioxide) in 2006-2010 and the authoritarian regime was the 31st worst performing country in ClimatePositions 2010. In 2005 the ranking was 34th and in 2000 43rd. The negative development under Putin is unquestionable.
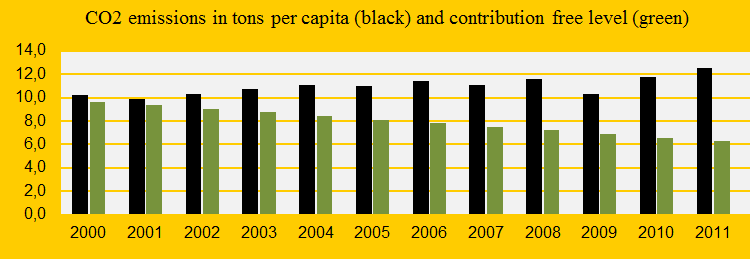
The annual CO2 Emissions in tons per capita since 2000 is shown in the diagram below (the green bars are the Contribution Free Levels). In 2011 the Russian CO2 Emissions were two times the free level. The overrun in 2011 accounted for $19 billion in supplementary Contribution (climate debt). The updated national Contribution amounts to $111 billion.
The diagram below shows Russia’s Contribution (debt) per capita in 2000, 2005 and 2010 compared to the global average and the better performing countries Croatia, Mexico, Turkey and Botswana. All countries with comparable GDP(ppp-$).

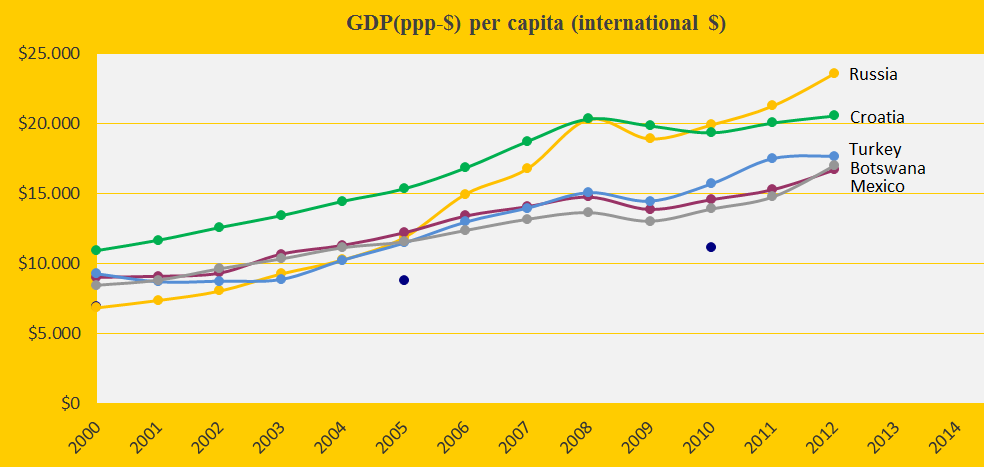
Below is shown the GDP(ppp-$) trends of the same five countries (the blue dots are the global average). It seems that Russia benefit economically on the cynical and damaging policy of Putin.
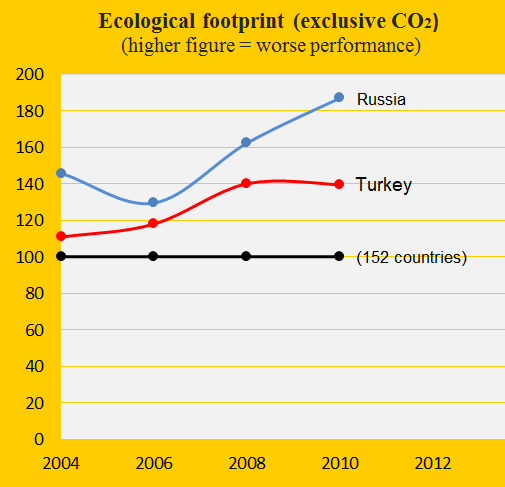
Also the Ecological Footprint has increased dramatically in Russia since 2006. The diagram below compares Russia with Turkey and the global average set to 100 (exclusive CO2 Emissions). Link with details on Ecological Footprint and other indicators are located in the menu “Calculations/Data Sources”.
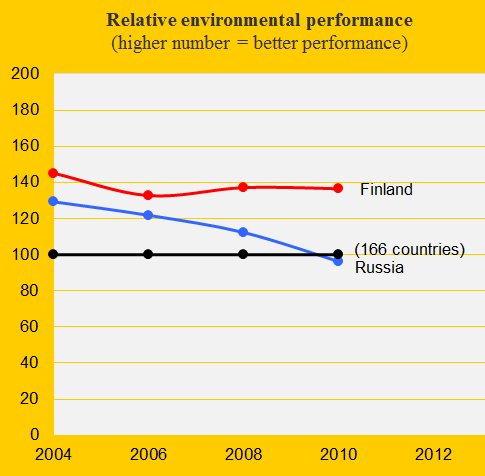
The Russian environmental performance has deteriorated bit by bit since 2004 and is now below the global average (set to 100 in the diagram below). Finland is shown as an example of a better and steadier performance.
Nuclear Power generation measured in kWh per capita has increased in Russia since 2000, contrary the world trend. In 2011-2012 Russia passed Germany as Nuclear Power producer per capita (see the diagram below).

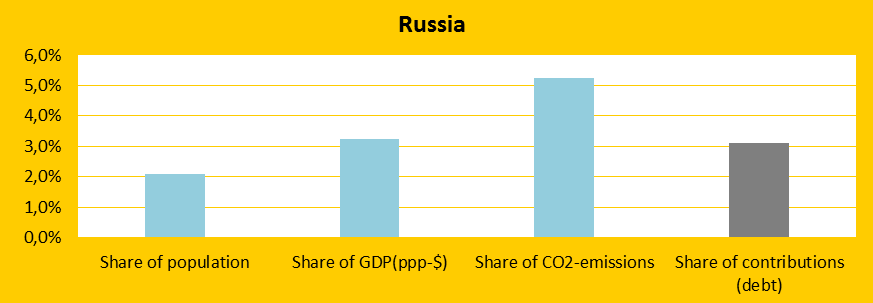
The last diagram (below) is from ClimatePositions 2010 and shows Russia’s total share of the global: 1) Population (2.1%), 2) GDP(ppp-$) (3.2%), 3) CO2 emissions (5.3%) and 4) Contributions (3.1%). If the negative development continues with declining planet responsibility and growing national GDP(ppp-$), the Russian share of the global contributions (climate debt) will increase dramatically the coming years.
A hypothetical example: Had Russia maintained the level of CO2 Emissions and Nuclear Power since 2000, Ecological Footprint and Environmental Performance since 2004 – and had the growth rate in GDP(ppp-$) been half since 2000, the total updated Climate Contribution (climate debt) would have been $58 billion instead of $111 billion, a saving of $53 billion.
Source on CO2 emissions: EIA, U.S. Energy Information Administration (links in the menu “Calculations”).
Information on national GDP(ppp-$) per capita is from Worldbank (links in the menu “Calculations”). Read about GDP+ in the submenu ”Indicators”.
Data on national and global populations are from the EIA, U.S. Energy Information Administration. Global population before 1980 is from United Nations (UN) (links in the menu “Calculations”).
Data on national nuclear power generation is from: World Nuclear Association (links in the menu “Calculations”).
Data sources on ecological footprint: WWF reports “The Living Planet” published 2006-2012 (links in the menu “Calculations”).
Data sources on environmental performance are from Yale and Columbia University reports, published 2006-2012 (links in the menu “Calculations”).
Drawing by Claus Andersen, 2013.
Comments are closed.