Russia’s Climate Debt keeps accelerating (however, the Environmental Performance has improved)
The accumulated Russian per capita Climate Debt is ranked 25th among 148 countries. Back in 2010 the ranking was 33rd. The reckless development also shows in Russia’s share of the global Climate Debt: 3.9% by January 2016 compared to 3.0% in 2010. Rankings are available in the menu “Climate Debt”. The following examines the development of CO2 Emissions, Environmental Performance, GDP(ppp-$) and Climate Debt, in comparison with some of ‘Russia’s largest trading partners’.
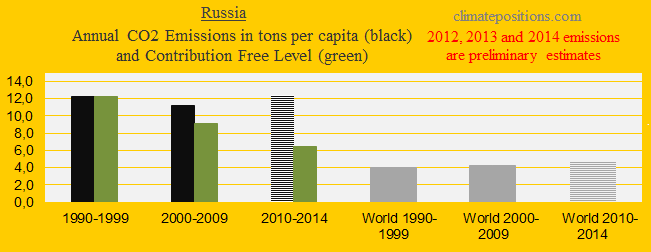
The first diagram shows the Russian per capita CO2 Emissions from fossil fuels (without bunker fuels) and cement production in decades in comparison with the world average. CO2 Emissions since 2012 are preliminary estimates. The green bars are the Contribution Free Level, determined by the level of CO2 Emissions in the 1990s and a number of continuously updated ‘Indicators’.
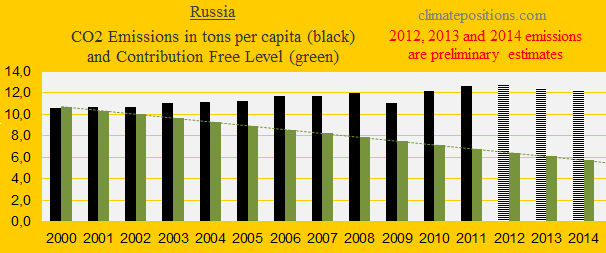
The diagram below shows the per capita CO2 Emissions from fossil fuels (without bunker fuels) and cement production since 2000. CO2 Emissions in 2012, 2013 and 2014 are preliminary estimates. Whether the slight emission-decrease since 2012 is due to economic slowdown or energy shifts doesn’t really matter for the climate.
Here are some key figures on Russia’s energy consumption (Btu): Between 2009 and 2012 the total energy consumption increased by 17.6%. During the same period the share of coal increased from 13.9% to 16.2% and the share of renewable electricity decreased from 6.4% to 5.1%.
The article ‘Russia’s Dream of Coal-Export Expansion Is at Risk – A Future Whose Growth May Be Mostly in Stranded Assets’ (September 2015), from ‘The Institute for Energy Economics and Financial Analysis (IEEFA)’, says: “The Russian government is also predicting domestic coal consumption will increase by almost one-third by 2030 and is planning significant expansion of new coal plants near the border with China so that power can be exported.”
Surely, Putin’s Russia is handling the global climate threats with arrogance and shortsightedness.
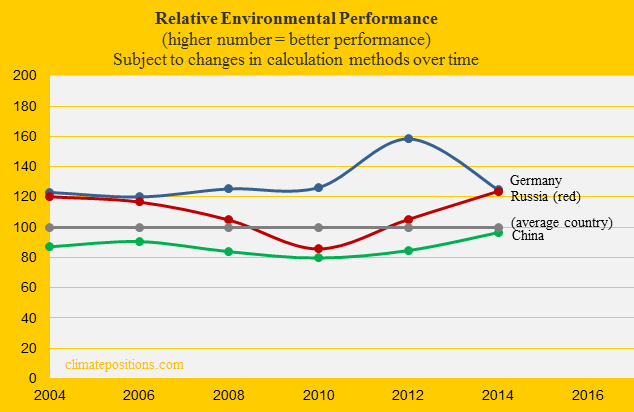
The relative Environmental Performance over time of Russia, Germany and China, with the world’s average set at 100, is shown below. The ‘Environmental Performance Index’ published January 2016 (data-year is set at 2014 in the diagram) ranks Russia 32th among 180 countries. See ‘Details on the Russian performance’. The previous ‘Index published in 2014’ ranked Russia 73rd. Substantial improvements since the last Index are on Water Resources, Air Quality and Fisheries.
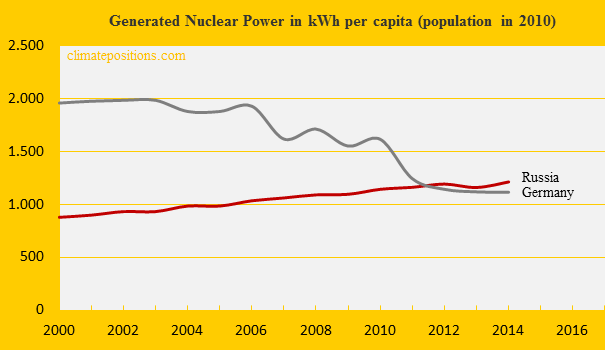
The next diagram shows Russia’s per capita Nuclear Power generation since 2000, in comparison with Germany. Around 2011 Russia passed Germany.
The diagram below shows the development of GDP(ppp-$) since 2000, in comparison with Netherlands, Germany, China, Ukraine and the world average. The high Russian growth-rate has slowed down recent years.

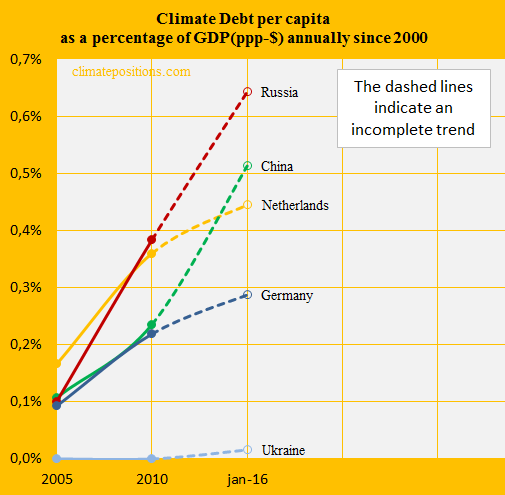
By January 2016 the Russian per capita Climate Debt was $1,557. The Climate Debts share of the GDP(ppp-$), annually since 2000, was 0.64% (ranked 14th; see the ‘ranking’). The miserable development since 2005 is shown in the diagram below along the same group of countries.
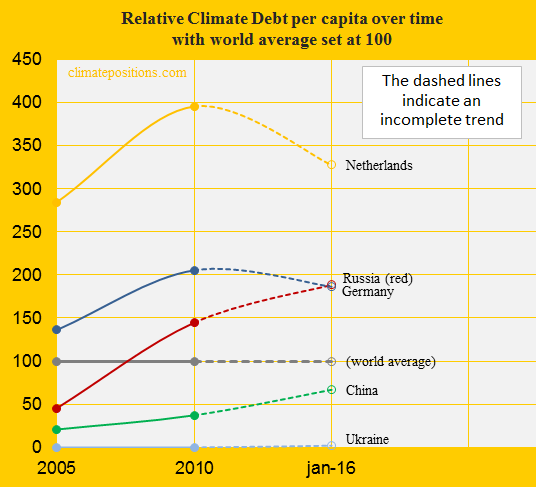
The last diagram shows the per capita Climate Debt since 2005, with the world average set at 100. Calculated this way, the Russian performance is miserable as well. In real money the accumulated total Russian Climate Debt increased from $78 billion in 2010 to $224 billion by January 2016 (see the ‘Ranking’).
.
Currently the accumulated Russian Climate Debt is $219 billion. The difference between the worst Environmental Performing year (data year of 2010), and the best Environmental Performing year (data year of 2014) – hypothetically performed during all years – would be $50 billion (249-199=50).
.
Data on carbon emissions (CO2 Emissions) from fossil fuels (without bunkers) and cement production are from
Global Carbon Project (CDIAC); (links in the menu “Calculations”).
Source on Environmental Performance: Yale and Columbia University reports, published 2006-2016 (links in the menu “Calculations”).
Information on national GDP(ppp-$) per capita: Worldbank (links in the menu “Calculations”).
Data on national Nuclear Power generation: World Nuclear Association (links in the menu “Calculations”).
Data on energy consumption (including coal and renewable electricity) is from ‘EIA‘.
Updated data and diagrams of all ‘indicators’ for all countries in ClimatePositions are also available in the menu ‘Calculations (Excel)’.
PowerPoint collage (Putin, The Coal-Addicted) by Claus Andersen, 2016.
Comments are closed.