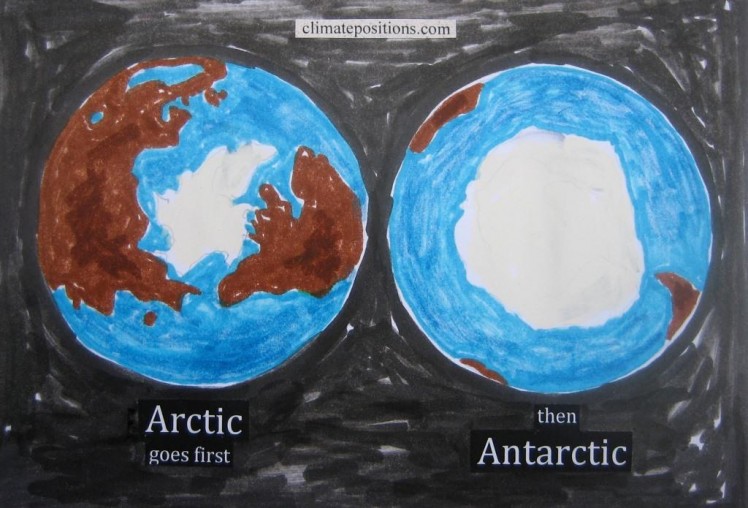
Sea level rises 58 m if all fossil fuels are extracted and burned

2015
A new ’simulation-study from Postdam Institute for Climate Impact Research’ shows that the Antarctic ice sheet would melt, causing the world’s sea level to rise about 58 m, if all the world’s resources of coal, oil and gas are extracted and burned. The following highlight some of the assumptions and outcomes of the study and besides visualize 30 m and 60 m sea level rise in fourteen of the world’s twenty largest cities (Tokyo, New York City, Seoul, Mumbai, Karachi, Osaka, Shanghai, Beijing, Calcutta, Cairo, London, Dhaka, Paris and Rio de Janeiro).
The study assumes that the current attainable fossil fuel resources hold between 8,500 and 13,600 GtC (Gigatons Carbon). Scenarios for the extraction and burning of additional 93-12,000 GtC are included. To avoid exceeding the 2°C global warming limit the cumulative emissions need to be limited to about 600 GtC compared to year 2010 (4-7% of the carbon resources). Between 2010 and 2014, the emissions were about 40 GtC (7% of the 600 GtC and 0.3-0.5% of the carbon resources).
If the current level of emissions proceeds for another sixty years and then drop to zero, then the 2°C global warming is unavoidable (corresponding to 600 GtC of additional carbon release) and the millennial sea level rise from Antarctica (alone) is likely to be about 2 m. The study finds that the West Antarctic Ice Sheet becomes unstable after 600-800 GtC.
With cumulative fossil fuel emissions of 10,000 gigatonnes of carbon (GtC), Antarctica is projected to become almost ice-free with an average contribution to sea level rise of more than 3 m per century during the first millennium. Over the next century Antarctica is projected to contribute very little to the sea level rise, compared to other sources. However, if global warming exceeds the 2°C limit, then the millennial-scale rates of sea level rise are projected to be dominated by ice loss from Antarctica. Read also the article ‘Burning all fossil fuels will melt entire Antarctic ice-sheet, study shows’ from The Guardian. See the NASA video ‘The Arctic and the Antarctic Respond in Opposite Ways’ (1:42 min) and read about the pole-differences ‘here’.
More frequent and more severe extreme weather-events, such as floods, is not an issue for the study, although these events are strongly related to global warming and sea level rise. The recent year’s climate destabilization due to about 1°C warming and 20 cm sea level rise is only a hint of what’s coming. To imply the consequences of 30 m and 60 m sea level rise on coastal and low areas, the maps of fourteen out of the twenty largest cities are shown below. The source is this interactive ‘world map’ from geology.com.
Sea level rise in New York.
Sea level rise in Seoul.
Sea level rise in Mumbai.
Sea level rise in Karachi.
Sea level rise in Osaka.
Sea level rise in Shanghai.
Sea level rise in Beijing.
Sea level rise in Calcutta.
Sea level rise in Cairo.
Sea level rise in London.
Sea level rise in Dhaka.
Sea level rise in Paris.
Sea level rise in Rio de Janeiro.
.
Study from Postdam Institute for Climate Impact Research (Article in Science Advances, 2015): ‘Combustion of available fossil fuel resources sufficient to eliminate the Antarctic Ice Sheet’ and the ‘press release’.
Interactive ‘sea level world map’ (0-60 m).
Drawing by Claus Andersen, 2015.
Comments are closed.


