Study: National climate pledges and the resulting Global Warming by 2100 (The Pledged Warming Map)
2018
The Paris Agreement collectively committed the countries to limit Global Warming to well below 2°C and pursue efforts to limit warming to 1.5°C above preindustrial levels. However, how much Global Warming by 2100 is each country’s climate pledge leading to, if all countries adopted the same national approach and ambition? This question is being tried answered for the world’s countries on the new website ‘paris-equity-check.org‘ (Pledged Warming Map). The underlying ‘Peer-reviewed study‘ is published November 2018 in Nature Communications.
The site says: “The Paris Agreement includes bottom-up pledges and a top-down warming threshold. Under this setting where countries effectively choose their own fairness principle, Paris-Equity-Check.org presents scientifically peer-reviewed assessments the ambition of countries’ climate pledges (the Nationally Determined Contributions or NDCs) and address the question: What is a fair and ambitious contribution to achieving the Paris Agreement?” Read ‘Ambition of pledges‘ and ‘The science‘.
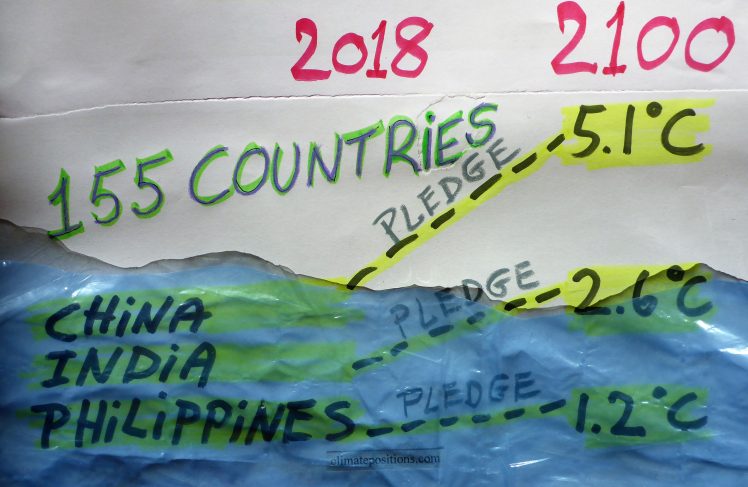
The table below shows 155 countries’ 1) ‘Per capita Climate Debt‘ in 2017, accumulated since 2000 in ClimatePositions, 2) per capita Fossil CO2 Emissions 2016, and 3) the pledges estimated effect on Global Warming by 2100 (Pledged Warming Map).
The table is read as follows: China’s current Climate Debt in ClimatePositions is $921 per capita, the Fossil CO2 Emissions 2016 was 7.5 tons per capita, and the pledged Chineese climate actions will lead to 5.1°C Global Warming by 2100 if the approach was adopted by all countries.
| . | Climate Debt | Fossil CO2 | Pledge effect on |
| . | per capita | Emissions, per | Global Warming |
| . | 2017 | capita 2016 | by 2100 |
| . | ↓ | . | . |
| Kuwait | $28,269 | 25.1 | 5.1°C |
| Brunei | $17,856 | 18.1 | 5.1°C |
| Trinidad and Tobago | $13,776 | 25.7 | 5.1°C |
| Luxembourg | $13,375 | 17.6 | 3.8°C |
| Oman | $12,274 | 19.9 | 5.1°C |
| Australia | $8,677 | 17.2 | 4.4°C |
| Canada | $8,384 | 18.6 | 5.1°C |
| Saudi Arabia | $8,225 | 16.0 | 5.1°C |
| United States | $7,387 | 15.6 | 4.0°C |
| South Korea | $5,086 | 11.9 | 4.7°C |
| Bahrain | $4,020 | 17.1 | 5.1°C |
| Finland | $3,634 | 9.3 | 3.5°C |
| Norway | $3,521 | 8.3 | 2.2°C |
| Ireland | $3,466 | 8.3 | 3.9°C |
| Austria | $3,275 | 8.5 | 3.2°C |
| Netherlands | $3,190 | 9.6 | 2.9°C |
| Singapore | $2,936 | 8.6 | 5.1°C |
| Estonia | $2,775 | 17.1 | 3.1°C |
| Kazakhstan | $2,748 | 12.9 | 5.1°C |
| Japan | $2,727 | 9.7 | 4.3°C |
| Belgium | $2,673 | 8.3 | 3.2°C |
| Israel | $2,511 | 8.0 | 3.8°C |
| Germany | $2,279 | 9.5 | 3.0°C |
| Czech Republic | $2,220 | 10.5 | 3.8°C |
| New Zealand | $2,119 | 7.1 | 5.1°C |
| Malaysia | $2,044 | 8.5 | 5.1°C |
| Slovenia | $2,005 | 7.1 | 3.9°C |
| Russia | $1,970 | 11.5 | 5.1°C |
| Bahamas | $1,962 | 11.3 | 2.3°C |
| Turkmenistan | $1,949 | 14.0 | 5.1°C |
| Cyprus | $1,569 | 5.9 | 2.5°C |
| Greece | $1,444 | 6.1 | 3.8°C |
| Spain | $1,435 | 5.4 | 3.4°C |
| Iran | $1,433 | 8.0 | 5.1°C |
| France | $1,374 | 5.1 | 2.6°C |
| Italy | $1,295 | 6.0 | 3.2°C |
| Libya | $1,216 | 8.4 | 5.1°C |
| Equatorial Guinea | $1,153 | 1.8 | 2.0°C |
| Switzerland | $1,124 | 4.7 | 1.6°C |
| Denmark | $1,095 | 6.7 | 3.0°C |
| Portugal | $1,058 | 4.8 | 4.1°C |
| United Kingdom | $1,057 | 5.6 | 2.9°C |
| China | $921 | 7.5 | 5.1°C |
| Poland | $912 | 7.8 | 3.7°C |
| Slovakia | $902 | 6.8 | 3.5°C |
| Venezuela | $870 | 5.6 | 5.1°C |
| Sweden | $868 | 4.5 | 2.7°C |
| South Africa | $770 | 7.0 | 5.1°C |
| Croatia | $759 | 4.6 | 4.0°C |
| Bosnia and Herz. | $749 | 7.3 | 5.1°C |
| Turkey | $654 | 4.6 | 5.1°C |
| Barbados | $648 | 5.4 | 4.3°C |
| Chile | $629 | 4.5 | 5.1°C |
| Serbia | $620 | 6.1 | 5.1°C |
| Argentina | $615 | 4.6 | 5.1°C |
| Bulgaria | $552 | 7.1 | 3.6°C |
| Hungary | $501 | 5.2 | 4.6°C |
| Belarus | $426 | 6.6 | 5.1°C |
| Gabon | $403 | 2.9 | 2.6°C |
| Mexico | $377 | 3.4 | 2.8°C |
| Thailand | $368 | 3.9 | 5.1°C |
| Suriname | $350 | 3.9 | 5.1°C |
| Lebanon | $334 | 3.6 | 5.1°C |
| Mongolia | $294 | 6.1 | 5.1°C |
| Mauritius | $276 | 2.5 | 4.9°C |
| Panama | $262 | 2.9 | 2.8°C |
| Algeria | $226 | 3.8 | 4.3°C |
| Macedonia | $218 | 4.3 | 5.1°C |
| Guyana | $201 | 4.2 | 1.6°C |
| Botswana | $181 | 2.9 | 5.1°C |
| Brazil | $144 | 2.2 | 3.7°C |
| Iraq | $135 | 4.4 | 3.9°C |
| Romania | $127 | 4.0 | 4.2°C |
| Ecuador | $118 | 2.4 | 1.5°C |
| Jamaica | $118 | 3.1 | 5.1°C |
| Indonesia | $108 | 2.0 | 2.5°C |
| Dominican Republic | $96 | 2.2 | 2.7°C |
| Egypt | $95 | 2.3 | 3.3°C |
| Jordan | $80 | 2.4 | 3.0°C |
| Ukraine | $69 | 5.3 | 5.1°C |
| Tunisia | $68 | 2.6 | 5.1°C |
| Uzbekistan | $58 | 3.5 | 5.1°C |
| Honduras | $19 | 1.0 | 1.3°C |
| Bolivia | $13 | 1.8 | 5.1°C |
| Vietnam | $11 | 2.2 | 5.1°C |
| Papua New Guinea | $6 | 1.1 | 1.2°C |
| Tonga | $4 | 2.3 | 1.2°C |
| Guatemala | $2 | 1.1 | 1.2°C |
| Lithuania | $0 | 4.7 | 5.1°C |
| Cuba | $0 | 2.6 | 5.1°C |
| Georgia | $0 | 2.2 | 5.1°C |
| Uruguay | $0 | 1.9 | 5.1°C |
| Armenia | $0 | 1.6 | 5.1°C |
| Namibia | $0 | 1.6 | 5.1°C |
| Paraguay | $0 | 0.9 | 5.1°C |
| Latvia | $0 | 4.1 | 4.9°C |
| Azerbaijan | $0 | 3.5 | 3.3°C |
| Moldova | $0 | 2.0 | 2.8°C |
| India | $0 | 1.9 | 2.6°C |
| Morocco | $0 | 1.6 | 2.6°C |
| Colombia | $0 | 1.6 | 2.6°C |
| Fiji | $0 | 1.9 | 2.2°C |
| El Salvador | $0 | 1.1 | 1.7°C |
| Sudan | $0 | 0.3 | 1.7°C |
| Tajikistan | $0 | 0.7 | 1.6°C |
| Swaziland | $0 | 0.5 | 1.6°C |
| Nicaragua | $0 | 0.9 | 1.4°C |
| Mauritania | $0 | 0.6 | 1.4°C |
| Bhutan | $0 | 2.1 | 1.2°C |
| Peru | $0 | 1.8 | 1.2°C |
| Costa Rica | $0 | 1.7 | 1.2°C |
| Philippines | $0 | 1.2 | 1.2°C |
| Kyrgyzstan | $0 | 1.2 | 1.2°C |
| Congo (Brazzaville) | $0 | 1.0 | 1.2°C |
| Yemen | $0 | 0.9 | 1.2°C |
| Pakistan | $0 | 0.9 | 1.2°C |
| Sri Lanka | $0 | 0.9 | 1.2°C |
| Samoa | $0 | 0.9 | 1.2°C |
| Laos | $0 | 0.7 | 1.2°C |
| Benin | $0 | 0.6 | 1.2°C |
| Solomon Islands | $0 | 0.6 | 1.2°C |
| Senegal | $0 | 0.5 | 1.2°C |
| Ghana | $0 | 0.5 | 1.2°C |
| Bangladesh | $0 | 0.5 | 1.2°C |
| Nigeria | $0 | 0.4 | 1.2°C |
| Cote d’Ivoire | $0 | 0.4 | 1.2°C |
| Cambodia | $0 | 0.4 | 1.2°C |
| Cameroon | $0 | 0.4 | 1.2°C |
| Timor-Leste | $0 | 0.4 | 1.2°C |
| Kenya | $0 | 0.3 | 1.2°C |
| Togo | $0 | 0.3 | 1.2°C |
| Haiti | $0 | 0.3 | 1.2°C |
| Sao Tome and P. | $0 | 0.3 | 1.2°C |
| Nepal | $0 | 0.3 | 1.2°C |
| Zambia | $0 | 0.3 | 1.2°C |
| Mozambique | $0 | 0.2 | 1.2°C |
| Liberia | $0 | 0.2 | 1.2°C |
| Guinea-Bissau | $0 | 0.2 | 1.2°C |
| Tanzania | $0 | 0.2 | 1.2°C |
| Sierra Leone | $0 | 0.2 | 1.2°C |
| Guinea | $0 | 0.2 | 1.2°C |
| Eritrea | $0 | 0.1 | 1.2°C |
| Comoros | $0 | 0.1 | 1.2°C |
| Burkina Faso | $0 | 0.1 | 1.2°C |
| Gambia | $0 | 0.1 | 1.2°C |
| Madagascar | $0 | 0.1 | 1.2°C |
| Uganda | $0 | 0.1 | 1.2°C |
| Rwanda | $0 | 0.1 | 1.2°C |
| Chad | $0 | 0.1 | 1.2°C |
| Burundi | $0 | 0.1 | 1.2°C |
| Ethiopia | $0 | 0.1 | 1.2°C |
| Niger | $0 | 0.1 | 1.2°C |
| Malawi | $0 | 0.1 | 1.2°C |
| Mali | $0 | 0.1 | 1.2°C |
| Dem. Rep. Congo | $0 | 0.1 | 1.2°C |
.
The website ‘paris-equity-check.org‘ (Equity Map and Pledged Warming Map)
The ‘Peer-reviewed study‘ underlying the website (“Warming assessment of the bottom-up Paris Agreement emissions pledges”). Published in Nature Communications, November 2018.
Updated data and diagrams of all ‘Indicators‘ and all countries in ClimatePositions are available in the menu ‘Calculations (Excel)‘.
Data on Fossil CO2 Emissions (excluding international shipping and aviation) including industrial processes (cement, steel, liming, etc.) are from EDGAR (European Commission) (links in the menu Calculations / Sources & Links).
Drawing by Claus Andersen, 2018.
Comments are closed.