Sweden with Nuclear Power and Norway with oilfields
2014
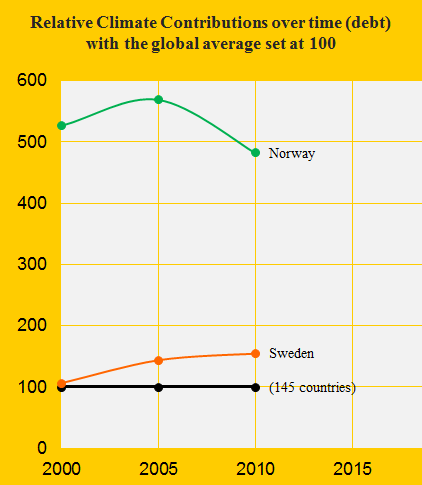
In ClimatePositions 2010, Norway was the 14th worst performing country – Sweden was number 30. See the relative Contributions per capita over time in the diagram. Norway, with only 0.07% of the world’s population, produces 2.80% of the world’s oil (crude extracted from reserves). In 2011, Norway was the world’s 14th largest oil producer. The neighboring country Sweden has no oil production but has the world’s largest Nuclear Power generation per capita.
The following examines the indicators: CO2 Emissions, Ecological Footprint, GDP(ppp-$) and Nuclear Power.
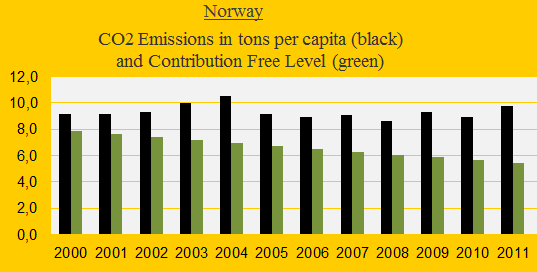
The Norwegian CO2 Emissions were 8.7 tons per capita in average in the 1990s and 9.3 tons in 2000-2011 (see the diagram below). The poor performance explains why Norway’s Climate Contribution (climate debt) in the latest update in ClimatePositions has accumulated to $13 billion since 2000 or $2,789 per capita. Read about the reputable Norwegian climate change financing ‘her’.
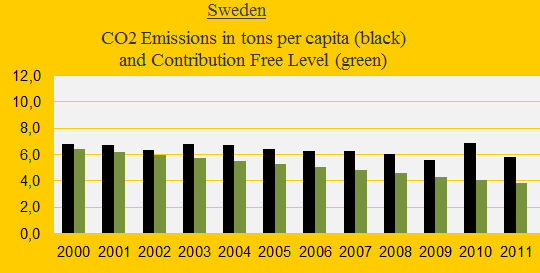
The Swedish CO2 Emissions were 7.1 tons per capita in average in the 1990s and 6.4 tons in 2000-2011. Sweden’s updated Climate Contribution is $8 billion or $880 per capita.
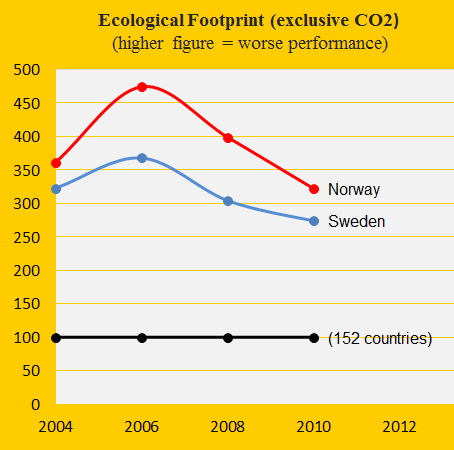
The Ecological Footprint (without CO2 Emissions) in Norway is the 7th largest in the world and Sweden is ranked 14. See the development since 2004 in the diagram below. A hypothetical example: An Ecological Footprint equivalent to the world’s average would reduce both countries’ Climate Contribution (debt) by $2 billion.
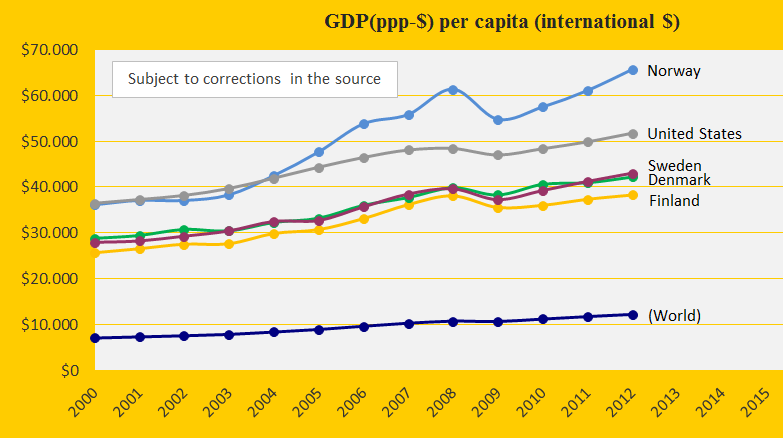
The diagram below shows the development in GDP(ppp-$) for the Scandinavian countries Norway, Sweden and Finland, plus United States and the world average. Norway makes big money from petroleum and its impact on climate change and the worsened conditions for generations to come.
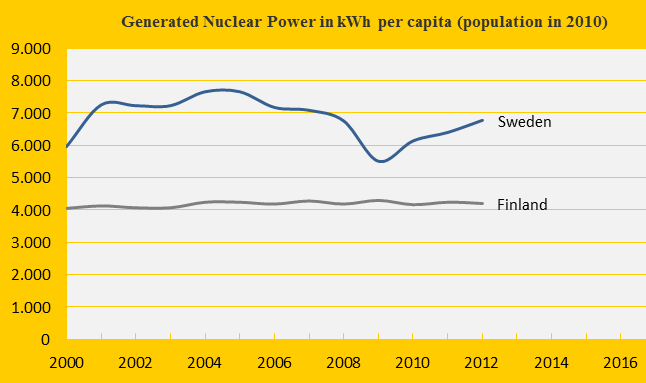
Had Sweden phased out the Nuclear Power generation since 2000 at the same rate as required for CO2 Emissions, the effect on the Climate Contribution (climate debt) would have been neutral (read more in the menue “Calculations/Indicators”). This is unfortunately not entirely the case (see the diagram below in comparison with Finland). The continuing high level of Nuclear Power generation costs Sweden $2 billion in ClimatePositions 2010.
Both Norway and Sweden are stable and impressively ranked between 3 and 9 in Environmental Performance since 2006 (better than Finland and Denmark). The forest cover has increased slightly since 1990 in both countries and is now 33.1% in Norway and impressive 68.7% in Sweden (Finland has 73% forest and Denmark 13%).
Source on ecological footprint: WWF reports “The Living Planet” published 2006-2012 (links in the menu “Calculations”).
Information on national GDP(ppp-$) per capita: Worldbank (links in the menu “Calculations”).
Source on CO2 emissions: EIA, U.S. Energy Information Administration (links in the menu “Calculations”).
Data on national nuclear power generation: World Nuclear Association (links in the menu “Calculations”).
Sources on national forest area: United Nations (UN) (links in the menu “Calculations”).
Comments are closed.