Taiwan – per capita Fossil CO2 Emissions and Climate Debt (estimated)

2020
Due to lack of some indicator data from the ‘sources‘ Taiwan is not ranked in ClimatePositions. However, by estimating the indicator values of GDP(ppp-$)¹, Forest Cover² and Ecological Footprint³, then the calculation of Taiwan’s Climate Debt can still be made with some accuracy.
With the noted indicator assumptions, then the Taiwanese current Climate Breakdown Pricing amounts to $40 per tons Fossil CO2 emitted since 2000, and the per capita Climate Debt amounts to $8,800 in 2020. For comparison, updated Rankings of 165 countries with full data are available in the menu “Climate Debt” (Taiwan ranks 13th).
The following diagrams expose the trends of Fossil CO2 Emissions, Nuclear Power and Environmental Performance.
The first diagram shows the Fossil CO2 Emissions per capita annually between 2000 and 2018. The green bars show the Free Emissions Level (with the noted indicator assumptions). The gap between the green and the black line is the calculation bases of the Climate Debt.

The second diagram shows Fossil CO2 Emissions in tons per capita in decades. Again, the green bars show the Free Emission Level. The grey bars are World Fossil CO2 Emissions average.

In the calculation of Climate Debt, the unacceptable Nuclear Power is converted into CO2 Emissions as if the electric power was produced with oil. As a consequence, Nuclear Power must be phased out at the same rate as Fossil CO2 Emissions. The diagram below shows the per capita Nuclear Power generation of Taiwan, China and Japan.
![]()
The final diagram shows the Environmental Performance of the same three countries, with an average country among 182 set at 100. Note that data is three years prior to the specified years.
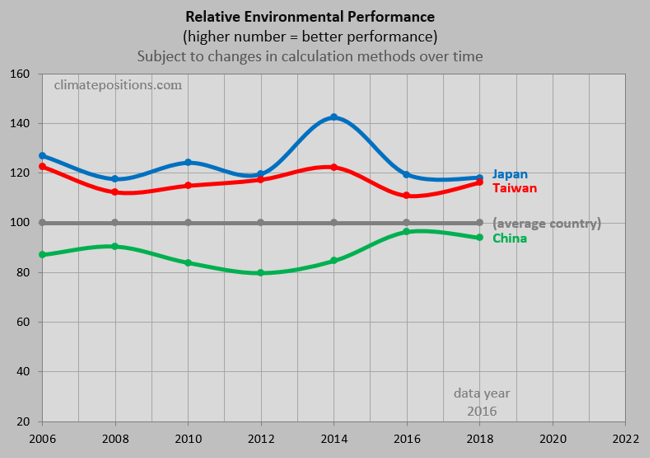
.
¹Taiwan’s GDP(ppp-$) is estimated to be similar to Australia’s ($51,663 in 2018).
²Taiwan’s Forest Cover and Primary Forest are both set to be unchanged in 2015 compared to 1990. Taiwan’s indicator value is set at zero.
³Taiwan’s Ecological Footprint without carbon is set at an average of nine countries with per capita GDP(ppp-$) comparable to Australia’s (±4). Taiwan’s indicator value is set at 186.
.
Updated data and diagrams of all ‘Indicators‘ and countries in ClimatePositions are available in the sub-menu ‘Calculations (Excel)‘.
Data on Fossil CO2 Emissions (excluding international shipping and aviation) including industrial processes (cement, steel, liming, etc.) are from EDGAR (European Commission) (links in the menu Calculations / Sources & Links). Direct link ‘here‘.
Data on national Nuclear Power generation: World Nuclear Association (links in the menu Calculations / Sources & Links).
Source on Environmental Performance: Yale and Columbia University (links in the menu Calculations / Sources & Links).
Drawing/illustration by Claus Andersen, 2020.
Comments are closed.