Top 5 CO2 Emitters’ Climate Contributions (climate debt) over time

2013
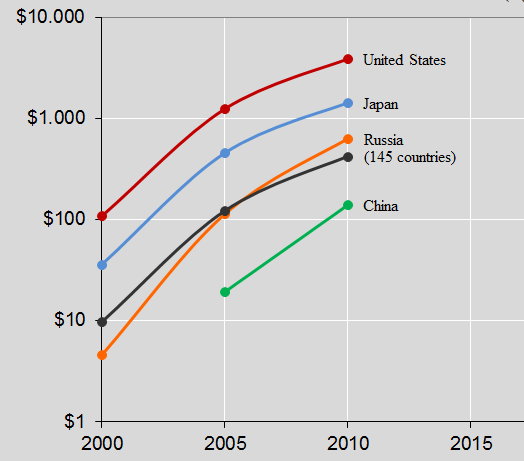
The 5 largest CO2 Emitters in 2006-2010 were 1. China (23,2%), 2. United States (19,7%), 3. Russia (5,3%), 4. India (5,1%) and 5. Japan (4,0%). These 5 countries accounted for 57,3% of the global CO2 Emissions (carbon dioxide). The diagram above shows the Contributions (climate debt) per capita in 2000, 2005 and 2010 (the black line is the global average). India was Contribution Free. Note the logarithmic scale. On the list of the worst performing countries (climate debt per capita) the ranking in 2010 was as follows: United States (no. 7), Japan (no. 18), Russia (no. 31), China (no. 57) and India (Contribution Free). See the full country list in the menu Contributions/Per Capita US$ Rank.
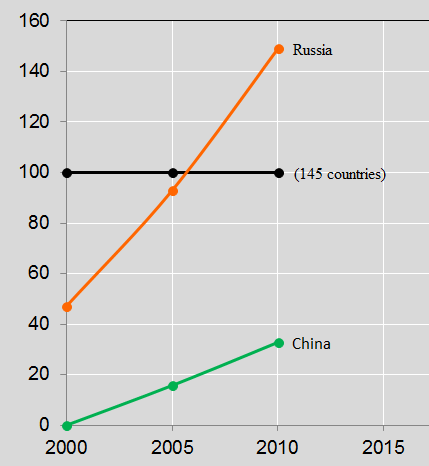
United States’ and Japan’s share of the global Climate Contributions showed a significant decrease from 2005 to 2010, but this development is almost entirely due some populous states’ increasing share from low levels of Contributions. China and Russia are the two most compelling examples. The diagram below shows the two countries relative Contributions (climate debt) in 2000, 2005 and 2010 with the global average set at 100. The picture is clear: The development in Russia under Putin represents a monster problem and China is rapidly moving the wrong way.
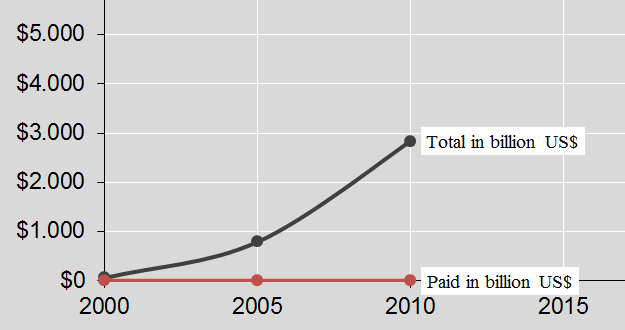
The diagram below shows the dramatic increase in the total global Climate Contributions in billion US$ over time. In 2010 the total Contributions were 2,834 billion US$. The total Contributions paid were $0 because the international community has not been able to make an agreement.
Read about the calculations of national contributions in the menu “About”. Calculations and diagrams are available in the spreadsheet in the menu “Calculations (Excel)”. Indicators are described in the menu “Indicators”. Sources are listed in the menu “Indicators & Links”.
Comments are closed.

