Trinidad and Tobago uses the planet as CO2 dump
2013
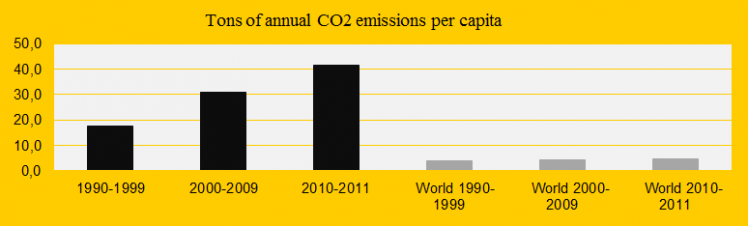
The islands Trinidad and Tobago close to Venezuela in South America gives a damn in global warming. The diagram shows the country’s CO2 Emissions (carbon dioxide) per decade compared to the global average. In 1990-1999 emissions were on average 17.4 tons of CO2 and in 2011 the figure was 42.4 tons. In ClimatePositions 2010 Trinidad and T. was the 5th worst performing country in the world with a Contribution (climate debt) of $6,805 per capita.
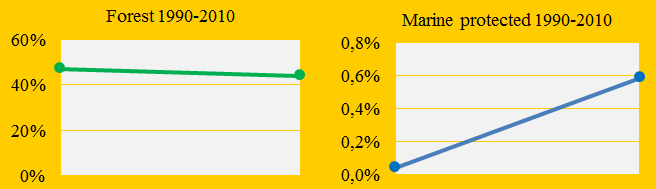
As shown in the diagram below, Trinidad and T. has a large forest proportion of the land area, but since 1990 the forest has been reduced from 47% to 44%. This reduction costs just under $300 million in the updated version of ClimatePositions (see the menu “Calculations (Excel”). The country has however increased the marine protected areas from 0.0% of the total sea in 1990 to 0.6% in 2010.
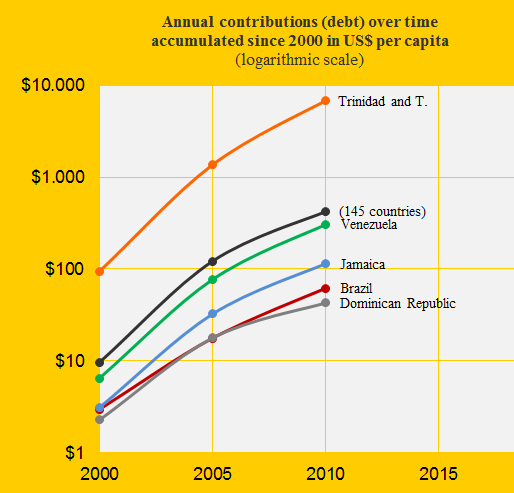
The last diagram shows the Contribution over time per capita for Trinidad and T., Venezuela, Jamaica, Brazil and Dominican Republic in comparison with the global average. Trinidad and Tobago with a Population of only 1.2 million (the number is declining), is by far the most climate-destructive country in the region.
Source on CO2 emissions: EIA, U.S. Energy Information Administration (links in the menu “Calculations”).
Data sources on national forest area are from the United Nations (UN)(links in the menu “Calculations”).
Data sources on national marine area protected are from the United Nations (UN)(links in the menu “Calculations”).
Comments are closed.