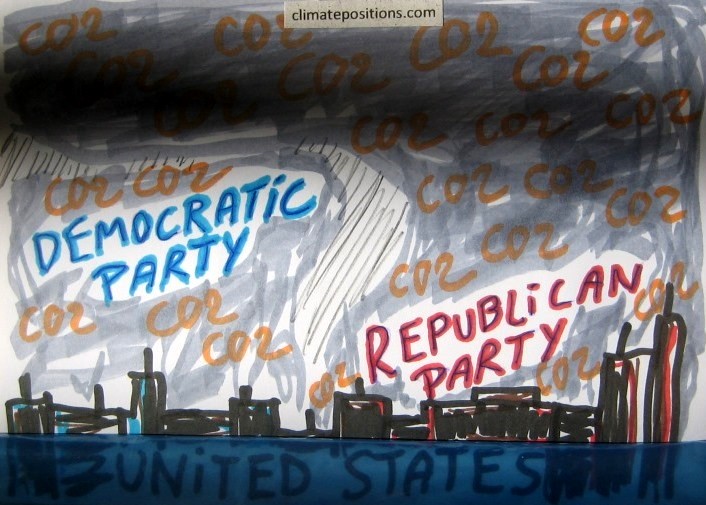
United States: Republican states double up in CO2 Emissions compared to Democratic states
2014
The United States was responsible for 42.8% of the global Climate Contribution (climate debt) of $2,834 billion in ClimatePositions 2010. The US climate debt as an annual percentage of GDP(ppp-$) since 2000 was 0.82% (the global ranking was 11th; see ‘here’). How the rich and diverse country will finance its climate debt and reduce CO2 Emissions is of course a domestic issue. The following examines the CO2 Emissions and average Climate Contributions (climate debt) of 27 Democratic and 24 Republican states (the presidential election in 2012).
To frame the climate-political situation in the United States, the table below shows the CO2 Emissions per capita for each state marked as Republican (red) and Democratic (blue). A quick calculation shows that the eight largest CO2 emitting Republican states emit an average of 55 tons of CO2 per capita (large and small states count the same). No country in the world exceeded 48 tons of CO2 per capita. The 24 Republican states emitted an average of 31.8 tons and the 27 Democratic states emitted 13.9 tons. What is the cause and effect is an open question, but since the United States has counteracted every attempt to reach a binding global climate agreement for decades, one might assume that a vote for the Republican Party so far has been a vote for climate destruction and extreme weather events worldwide. Read about demographic global warming opinion profiles in US ‘here‘.
| Republican (red) | 2011 | |
| Democratic (blue) | CO2 per capita | |
| 1. | Wyoming | 112.8 |
| 2. | North Dakota | 73.5 |
| 3. | Alaska | 52.7 |
| 4. | West Virginia | 51.8 |
| 5. | Louisiana | 48.8 |
| 6 | Kentucky | 33.9 |
| 7. | Montana | 32.0 |
| 8. | Indiana | 31.8 |
| 9. | Iowa | 28.5 |
| 10. | Nebraska | 28.4 |
| 11. | Oklahoma | 28.3 |
| 12. | New Mexico | 27.2 |
| 13. | Alabama | 26.9 |
| 14. | Texas | 25.6 |
| 15. | Kansas | 25.2 |
| 16. | Arkansas | 22.8 |
| 17. | Utah | 22.7 |
| 18. | Missouri | 22.6 |
| 19. | Mississippi | 20.6 |
| 20. | Ohio | 20.2 |
| 21. | Pennsylvania | 19.2 |
| 22. | Colorado | 18.0 |
| 23. | South Dakota | 17.9 |
| 24. | Illinois | 17.5 |
| 25. | South Carolina | 17.2 |
| 26. | Minnesota | 17.0 |
| 27. | Wisconsin | 16.8 |
| 28. | Tennessee | 16.1 |
| 29. | Michigan | 15.9 |
| 30. | Georgia | 15.7 |
| 31. | Delaware | 14.4 |
| 32. | Arizona | 14.2 |
| 33. | Hawaii | 14.0 |
| 34. | Maine | 13.3 |
| 35. | North Carolina | 12.7 |
| 36. | New Hampshire | 12.5 |
| 37. | New Jersey | 12.5 |
| 38. | Nevada | 12.4 |
| 39. | Virginia | 12.0 |
| 40. | Florida | 11.9 |
| 41. | Maryland | 11.0 |
| 42. | Rhode Island | 10.5 |
| 43. | Washington | 10.4 |
| 44. | Idaho | 10.1 |
| 45. | Massachusetts | 10.0 |
| 46. | Connecticut | 9.8 |
| 47. | Oregon | 9.6 |
| 48. | Vermont | 9.4 |
| 49. | California | 9.2 |
| 50. | New York | 8.1 |
| 51. | Distr. of Columbia | 5.1 |
.
Hypothetical example no. 1: If all states in the U.S. emitted the same CO2 per capita since 1990 as the Democratic states, then the current national Climate Contribution (debt) would be $4,100¹ per capita instead of $5,182.
Hypothetical example no. 2: If all states in the U.S. emitted the same CO2 per capita since 1990 as the Republican states, then the current national Climate Contribution (debt) would be $6,700¹ per capita instead of 5,182.
¹ The Calculation is not consistent but the overall picture is clear. Included in the calculation are 1) CO2 Emissions per capita by state and 2) Median household income by state (set at $54,564 per capita in Democratic states and $45,362 in Republican states).
.
Source on CO2 Emissions: ‘EIA‘ (U.S. Energy Information Administration) and ‘Wikipedia‘.
Information on the presidential election 2012: ‘Wikipedia‘.
Information on household income by state: ‘Wikipedia‘.
Drawing by Claus Andersen, 2014.
Comments are closed.