Update 2015: Global Population now 7.35 billion (life expectancy, births rates and an alarming prediction)
The estimated Global Population increased from 7.26 billion in 2014 to 7.35 billion in 2015 – an increase of 1.2%, or 87 million, in one year. See the population growth 1960-2015 in the diagram below. Some surprising demographic trends of life expectancy and births rates, and a long term Global Population prediction, are included.
The diagram shows global trends with 1960-values set at 100:
- Blue line: The average global crude birth rate between 1960 (31.9 per 1000) and 2013 (19.4 per 1000). The values indicate the number of live births occurring per 1000 inhabitants during one year.
- Green line: The average global life expectancy between 1960 (52.5 years) and 2013 (71.2 years). The values indicate the life span a newborn infant would live if prevailing patterns of mortality at the time of its birth were to stay the same throughout its life.
- Red line: Global Population 1960-2015.
- Red dots: Global Population prediction by 2100, from ‘World Population Prospects – The 2015 Revision’ (UN DESA report; read ‘more’).
- Red stippled line: Global Population polynomial projection by 2100 (15.9 billion). This mathematical projection is entirely based on the number of humans in the past (demographic changes and developing trends are not taken into account).
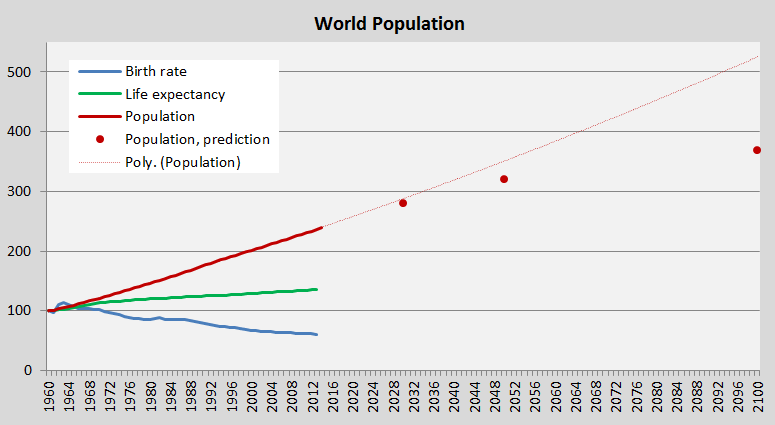
The growing life expectancy and falling birth rate are both (separately) encouraging for Homo sapiens’ existence on Earth. However, combined the two trends add up to a population challenge of gigantic proportions, although the growth rate is predicted to decline in the coming decades. A Global Population of 8.5 billion by 2030, 9.7 billion by 2050 and 11.2 billion by 2100, will make the handling of problems with greenhouse gas emissions, biodiversity and natural resources, extremely tough.
.
National Climate Debts in ClimatePositions increase due to the Global Population-growth. One example: 1.9% of the accumulated Climate Debt of Australia is due to the growing Global Population between 2000 and 2015 (the 1.9% amounts to $3 billion or $0.47 per tons CO2 emitted from fossil fuels since 2000).
.
Data on national and global Populations: EIA, U.S. Energy Information Administration (links in the menu “Calculations”). Figures from 2012-2014 are from CIA World Factbook; published at ‘photius.com’.
PowerPoint Diagram Image is by Claus Andersen, 2016.
Comments are closed.