Update of GDP(ppp-$) 2013
2014
The Climate Contributions (climate debt) in ClimatePositions increases with growing GDP(ppp-$)¹. The 2013 updates and adjustments back in time have now been released (see the ‘World Bank’). For some countries, this means large growth of GDP(ppp-$) since 2000 and thus large increases in Climate Contributions. In other words, the previous data tended to be too modest with respect to the wealth of many countries, in particular Iraq, Jordan, Indonesia, Kazakhstan and Egypt, and the rich authoritarian oil regimes Kuwait, Oman, Saudi Arabia and Qatar. The updated Climate Contributions per capita worldwide are available ‘here’ and in the spreadsheet in the menu ‘Calculations‘. See the Climate Contributions as a percentage of the annual GDP(ppp-$) ‘here‘.
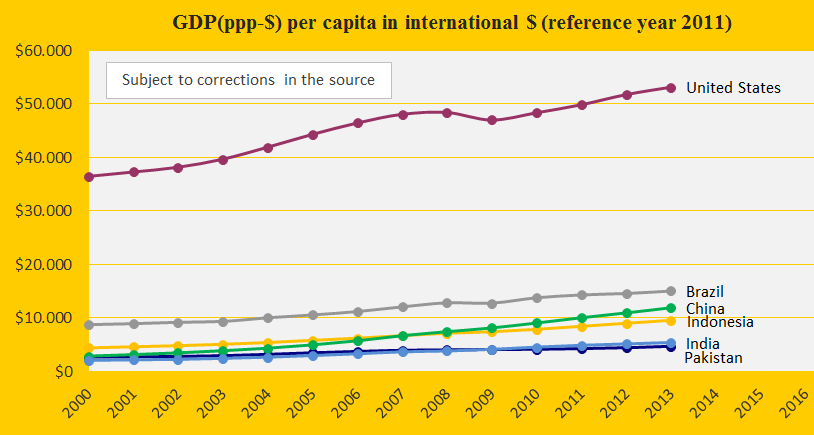
The diagram below shows the development of GDP(ppp-$) in 2000-2013 of the world’s six most populous countries: China, India, United States, Indonesia, Brazil and Pakistan. Read an unorthodox definition of GDP(ppp-$) on this ‘blog‘.
¹ Contributing Free countries will remain Contribution Free regardless of the size of the GDP(ppp-$). The idea is that the economic incentives for the green transition must be equal for rich and poor countries.
An hypothetical example: if the United States had all the Brazilian indicator values except the GDP(ppp-$), then the accumulated U.S. Climate Contribution (debt) would be $140 billion instead of $1,640 billion.
Information on national GDP(ppp-$) per capita: Worldbank (links in the menu “Calculations”).
Drawing by Claus Andersen, 2014.
Comments are closed.