Venezuela – per capita Fossil CO2 Emissions and Climate Debt (economic collapse)

2020
Venezuela’s current Climate Breakdown Pricing amounts to $10.04 per tons Fossil CO2 emitted since 2000. The Climate Debt grew from $655 per capita in 2015 to $1,045 in 2020. However, once updated data on national GDP(ppp-$) is released, then the current Climate Debt will prove to be considerably smaller (more below). Updated Rankings of 165 countries are available in the menu “Climate Debt”.
The following diagrams expose the trends of Fossil CO2 Emissions, GDP(ppp-$), Climate Debt, Forest Cover, Primary Forest and Ecological Footprint without carbon.
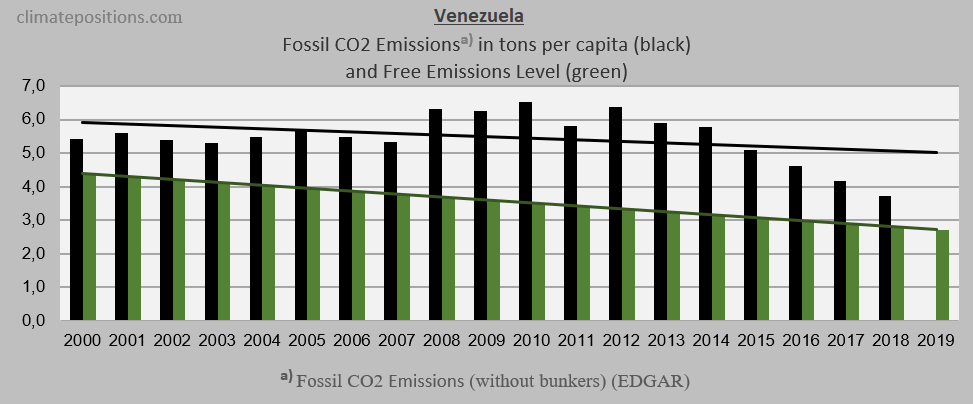
The first diagram shows the Fossil CO2 Emissions per capita annually between 2000 and 2018. The green bars show the Free Emissions Level. The gap between the green and the black line is the calculation bases of the Climate Debt. The dramatic reductions since 2014 are accompanied by a devastating economic collapse.
The second diagram shows Fossil CO2 Emissions in tons per capita in decades. Again, the green bars show the Free Emission Level. The grey bars are World Fossil CO2 Emissions average.

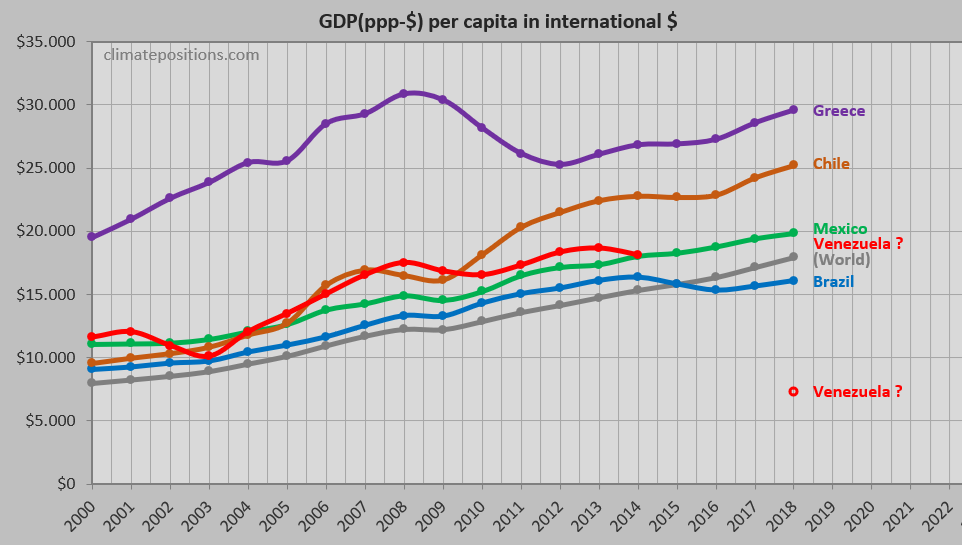
The next diagram shows per capita GDP(ppp-$) of Venezuela, Brazil, Mexico, Chile, Panama and Ecuador and World average. The lower Venezuelan scenario (red circle) shows a more likely 60% decrease of GDP in 2018, compared to 2014 (instead of World-trend growth due to lack of national data).
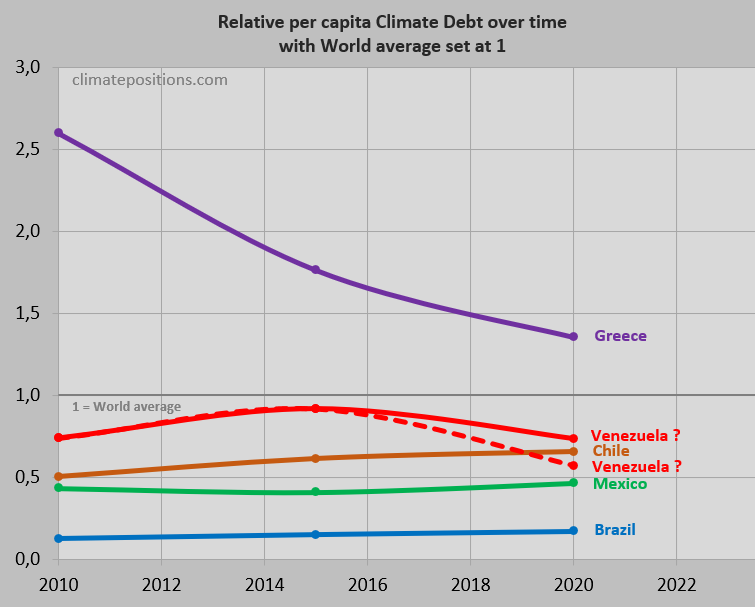
The third diagram shows the ‘per capita Climate Debt‘ trends between 2010 and 2020, with World average set at 1, of Venezuela, Brazil, Mexico, Chile, Panama and Ecuador. The stippled line shows the 60% GDP-decrease scenario in which the current Venezuelan Climate Debt would be $813 per capita, instead of $1,045.
The last diagram shows the changes in Forest Cover and Primary Forest between 1990 and 2015. Had Venezuela kept its Forest Cover since 1990, and had all become Primary Forest, then the current Climate Debt would decrease by 34%. Global forest-updates are expected in 2020.

.
Updated data and diagrams of all ‘Indicators‘ and countries in ClimatePositions are available in the sub-menu ‘Calculations (Excel)‘.
Data on Fossil CO2 Emissions (excluding international shipping and aviation) including industrial processes (cement, steel, liming, etc.) are from EDGAR (European Commission) (links in the menu Calculations / Sources & Links). Direct link ‘here‘.
Information on national GDP(ppp-$) per capita: Worldbank (links in the menu Calculations / Sources & Links).
Forest Data on national Forest Cover and Primary Forests are from United Nations UN (Report: Global Forest Resources Assessments) (links in the menu Calculations / Sources & Links).
Drawing/illustration by Claus Andersen, 2020.
Comments are closed.