Vietnam – per capita Fossil CO2 Emissions and Climate Debt
2020
Vietnam’s current Climate Breakdown Pricing amounts to $0.88 per tons Fossil CO2 emitted since 2000. The Climate Debt grew from $6 per capita in 2015 to $26 in 2020. Updated Rankings of 165 countries are available in the menu “Climate Debt”.
The following diagrams expose the trends of Fossil CO2 Emissions, Climate Debt, GDP(ppp-$), Forest Cover, Primary Forest and Ecological Footprint without carbon.
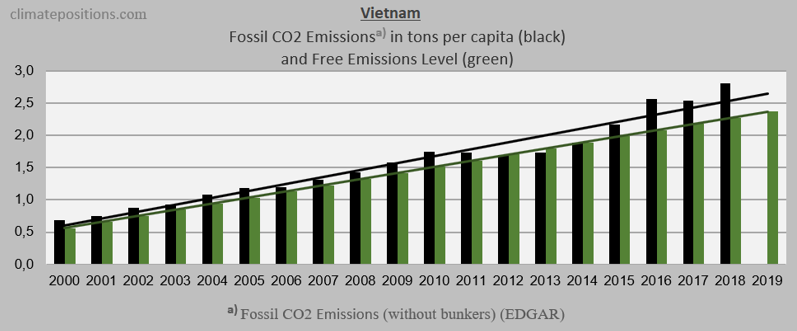
The first diagram shows the Fossil CO2 Emissions per capita annually between 2000 and 2018. The green bars show the Free Emissions Level. The gap between the green and the black line is the calculation bases of the Climate Debt.
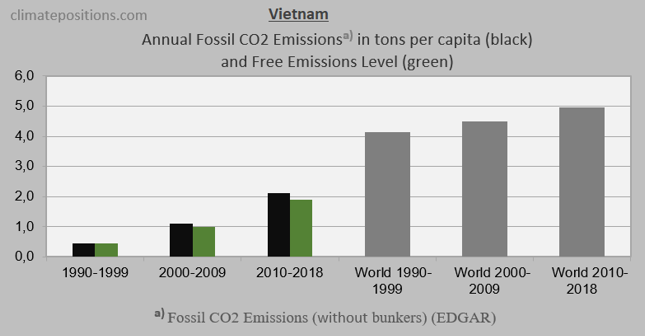
The second diagram shows Fossil CO2 Emissions in tons per capita in decades. Again, the green bars show the Free Emission Level. The grey bars are World Fossil CO2 Emissions average.
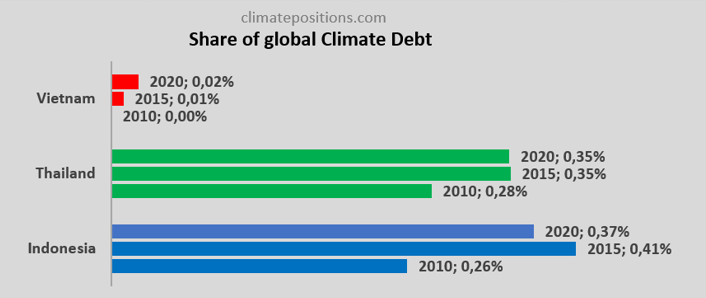
The third diagram shows the Climate Debt as ‘Share of global Climate Debt‘ in 2010, 2015 and 2020, of Vietnam, Thailand and Indonesia.
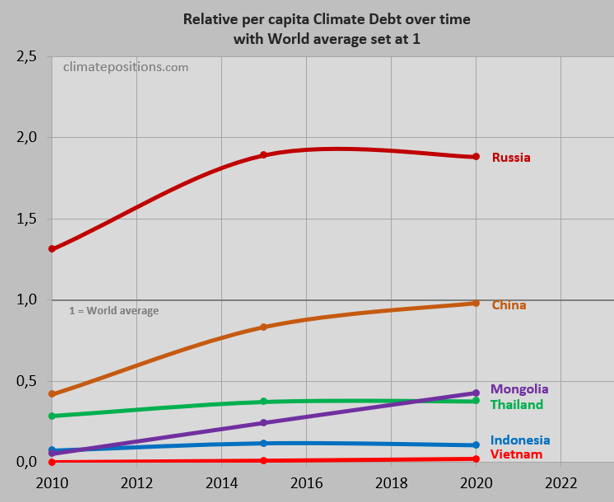
The fourth diagram shows the ‘per capita Climate Debt‘ trends between 2010 and 2020, with World average set at 1, of Vietnam, Thailand, Indonesia, China, Russia and Mongolia.
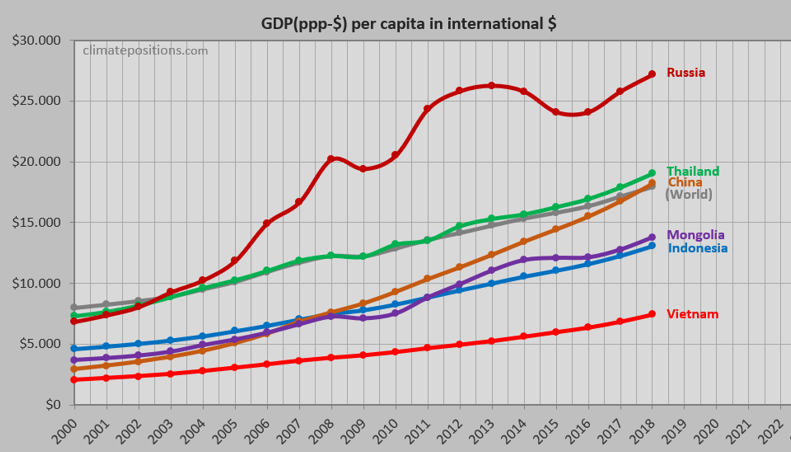
The diagram below shows per capita GDP(ppp-$) of the same six countries and World average.
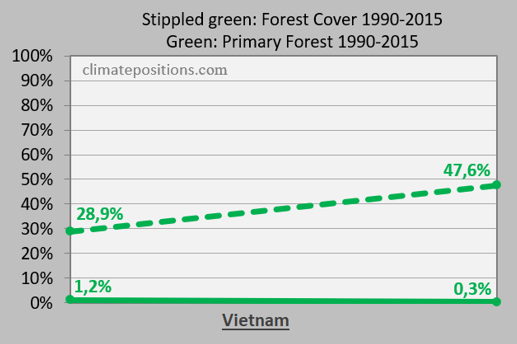
The next diagram shows the changes in Forest Cover and Primary Forest between 1990 and 2015. Global updates are expected in 2020. Had Vietnam not increased its Forest Cover by 18.7% compared to 1990, then the Climate Debt would have been $68 per capita, instead of $26.
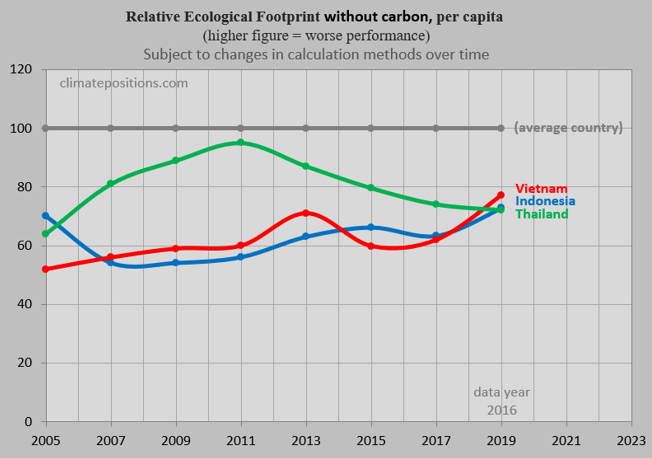
The final diagram shows the relative per capita Ecological Footprint without the carbon footprint of Vietnam, Thailand and Indonesia, with an average country among 181 set at 100. Note that data is around three years prior to the specified years.
.
Updated data and diagrams of all ‘Indicators‘ and countries in ClimatePositions are available in the sub-menu ‘Calculations (Excel)‘.
Data on Fossil CO2 Emissions (excluding international shipping and aviation) including industrial processes (cement, steel, liming, etc.) are from EDGAR (European Commission) (links in the menu Calculations / Sources & Links). Direct link ‘here‘.
Information on national GDP(ppp-$) per capita: Worldbank (links in the menu Calculations / Sources & Links).
Forest Data on national Forest Cover and Primary Forests are from United Nations UN (Report: Global Forest Resources Assessments) (links in the menu Calculations / Sources & Links).
Source on Ecological Footprint: Global Footprint Network (links in the menu Calculations / Sources & Links).
Drawing/illustration by Claus Andersen, 2020.
Comments are closed.