World CO2 Emissions 2000-2059: with 50% risk of 2C global warming (two per capita emission-scenarios for the United States, Denmark, Spain, China, India and Nigeria)
2017
In continuation of the previous article ‘Carbon Brief: Global Carbon Budget and CO2 Emission scenarios (50% risk of 1.5°C, 2.0°C and 3.0°C warming)‘, the following examines the per capita CO2 Emission budget 2000-2059, with a 50% risk of 2°C global warming (which of course is unacceptable). The outcome is then compared with Climate Debt Free CO2 Emission levels (in ClimatePositions) of the United States, Denmark, Spain, China, India and Nigeria, during the same 60-year period. Also, the Paris Agreements reduction commitment of the United States is put into perspective.
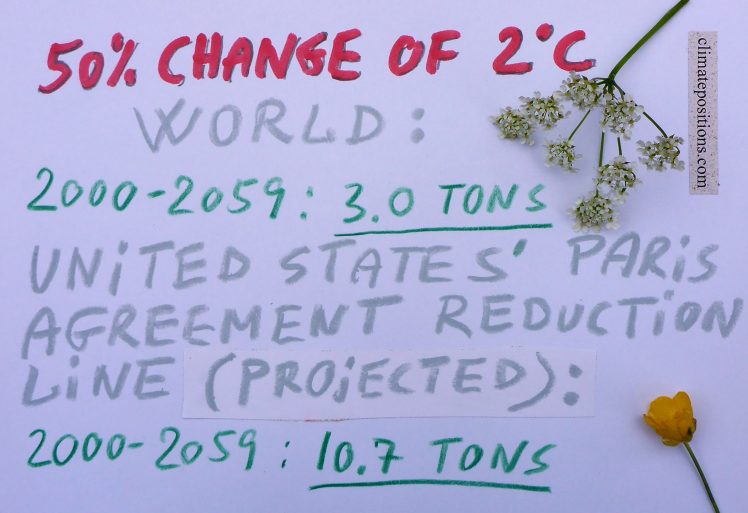
By combining world population projections and carbon budget data from Carbon Brief, it appears that the worlds average CO2 Emissions from Fossil Fuels (without bunker) and cement, between 2000 and 2059, must be around 3.0 tons on average per capita, annually, to leave the planet with a 50% risk of 2°C global warming.
However, since emissions were 4.5 tons per capita on average between 2000 and 2015, the remaining 44-year period (2016-2059) must drop to around 2.5 tons on average to reach the 50% change. Note that neither dangerous feedback loops nor the latest heating records are included in the calculation, and that the scenario leave future generations with a rest-budget of 0.33 tons of CO2 on average per capita, annually, between 2060 and 2071.
A hypothetical example: The United States’ commitment in the Paris Agreement 2015, is 16% emission reduction by 2025, compared to 2005. If this becomes real, and the reduction rate between 2000 and 2025 furthermore is projected to 2059, along with the current population growth, then the CO2 Emissions of the United States would be 10.7 tons on average per capita, annually, between 2000 and 2059. For comparison, a global emission average of 3.0 tons per capita is way too high to secure the 2°C global warming limit.
The table below shows the per capita CO2 Emissions from Fossil Fuels (without bunker) and cement in tons of six countries, with tree columns and two scenarios from ClimatePositions (column B and C):
A. The average CO2 Emissions in the 1990s (world average in green).
B. The average Climate Debt Free emissions level 2000-2059, with the current national ‘Indicator‘-values and projected global indicators of Population and CO2 Content¹ in the atmosphere (both effect the CO2 Emission target).
C. Similar to B, except with improved national ‘Indicator‘-values between 2020 and 2059, defined as follows: a) Environmental Performance goes up ten rankings, b) Ecological Footprint (without carbon) goes up ten rankings, c) Forest Cover goes up 10%, d) 50% of the Forest Cover will be Primary Forests, e) 10% of the national waters will be protected, and f) Nuclear Power will be shut down.
The table is read like this: The United States emitted 19.4 tons of CO2, annually, in 1990s (column A), and US must reduce emissions to 5.4 tons on average, annually, between 2000 and 2059, to become Climate Debt Free by 2060 (column B). However, if the US indicator-values are improved as defined above, then US can emit 6.2 tons instead of 5.4 tons, or 15% more (column C).
| . | A) Per capita | B) With current | C) With improved |
| . | CO2 Emmissions | indicator-values | indicator-values |
| . | 1990-1999 | 2000-2059 | 2000-2059 |
| . | . | . | . |
| United States | 19.4 | 5.4 | 6.2 (+15%) |
| Denmark | 11.2 | 3.8 | 4.1 (+6%) |
| Spain | 6.1 | 3.0 | 3.4 (+15%) |
| China | 2.5 | 1.9 | 2.2 (+12%) |
| India | 0.8 | 1.5 | 1.6 (+11%) |
| Nigeria | 0.4 | 1.2 | 1.2 (+6%) |
| World | 4.0 | – | – |
The six countries combined emitted 3.6 tons per capita in 1990s, and with the current national ‘Indicator‘-values they can emit 2.0 tons on average, annually, between 2000 and 2059, to become Climate Debt Free by 2060. In other words: ClimatePositions deliver a fair CO2 Emissions reduction plan in reasonable accordance with the 2°C global warming limit.
.
¹The current CO2 Content increase-rate is projectet to 2059.
.
Carbon Brief calculations: ‘https://www.carbonbrief.org/analysis-only-five-years-left-before-one-point-five-c-budget-is-blown‘.
Data on carbon emissions (CO2 Emissions) from Fossil Fuels (without bunkers) and cement production are from Global Carbon Project (CDIAC); (links in the menu Calculations / Sources & Links).
Data on national and global Populations is from Worldbank (links in the menu Calculations / Sources & Links). Projections are from ‘UN‘.
Drawing by Claus Andersen, 2017.
Comments are closed.