World’s Nuclear Power generation 2015: 1.3% growth compared to 2014
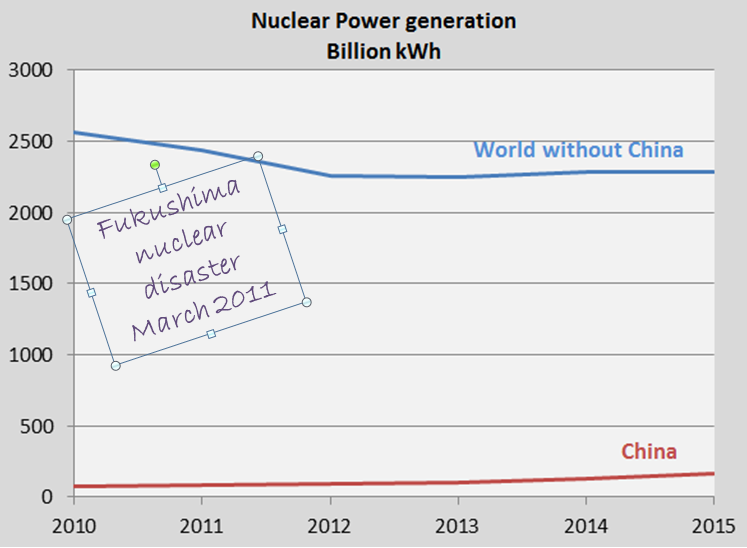
The world’s Nuclear Power generation increased by 1.3% in 2015 compared to 2014 (and 4.0% increase compared to 2012). The table below shows the generation in billion kWh of all Nuclear Power nations and the global generation, since 2010. China increased the generation by 30.2% in 2015 compared to 2014, while the rest of the world the decreased the generation by 0.3%. The global generation level in 2015 is still 7.1% below the 2010-level.
Not only does Nuclear Power generation produce dangerous radioactive waste to deal with for thousands of future generations (10,000 to 250,000 years), it also causes catastrophic disasters with extremely dangerous nuclear radiation, causing death, birth defects and cancer among people, poison agricultural land, and otherwise damages the environment for many generations. In ClimatePositions Nuclear Power is therefore not accepted as a national CO2 Emission reduction instrument and the generation must be phased out parallel to the reductions in CO2 Emissions (Nuclear Power is converted into CO2 Emissions as if the Nuclear Energy was produced with oil and the average annual production since 2000, compared to the average annual production in 1992-1999, has direct effect on the level of allowable national CO2 Emissions from Fossil Fuels and cement production).
The blue brackets in the 2015-column show the ranking of Nuclear Power generation per capita.
| . | . | 2010 | 2011 | 2012 | 2013 | 2014 | 2015 |
| . | . | . | . | . | . | . | .(p. c. rank) |
| . | World | 2,628.6 | 2,515.7 | 2,346.0 | 2,359.0 | 2,411.0 | 2,441.0 |
| 1. | United States | 807.1 | 790.4 | 770.7 | 790.2 | 798.6 | 798.0 (9) |
| 2. | France | 410.1 | 423.5 | 407.4 | 405.9 | 418.0 | 419.0 (1) |
| 3. | Russia | 159.4 | 162.0 | 166.3 | 161.8 | 169.1 | 182.8 (16) |
| 4. | China | 71.0 | 82.6 | 92.7 | 104.8 | 123.8 | 161.2 (25) |
| 5. | South Korea | 141.9 | 147.8 | 143.5 | 132.5 | 149.2 | 157.2 (4) |
| 6. | Canada | 85.5 | 88.3 | 89.1 | 94.3 | 98.6 | 95.6 (6) |
| 7. | Germany | 133.0 | 102.3 | 94.1 | 92.1 | 91.8 | 86.8 (18) |
| 8. | Ukraine | 84.0 | 84.9 | 84.9 | 78.2 | 83.1 | 82.4 (13) |
| 9. | United K. | 56.9 | 62.7 | 64.0 | 64.1 | 57.9 | 63.9 (19) |
| 10. | Spain | 59.3 | 55.1 | 58.7 | 54.3 | 54.9 | 54.8 (17) |
| 11. | Sweden | 55.7 | 58.1 | 61.5 | 63.7 | 62.3 | 54.5 (2) |
| 12. | Taiwan | 40.4 | 40.4 | 38.7 | 39.8 | 40.8 | 35.1 (15) |
| 13. | India | 20.5 | 28.9 | 29.7 | 30.0 | 33.2 | 34.6 (30) |
| 14. | Czech Rep. | 26.4 | 26.7 | 28.6 | 29.0 | 28.6 | 25.3 (10) |
| 15. | Belgium | 45.7 | 45.9 | 38.5 | 40.6 | 32.1 | 24.8 (11) |
| 16. | Finland | 21.9 | 22.3 | 22.1 | 22.7 | 22.6 | 22.3 (3) |
| 17. | Switzerland | 25.3 | 25.7 | 24.4 | 25.0 | 26.5 | 22.2 (5) |
| 18. | Hungary | 14.7 | 14.7 | 14.8 | 14.5 | 14.8 | 15.0 (14) |
| 19. | Bulgaria | 14.2 | 15.3 | 14.9 | 13.3 | 15.0 | 14.7 (12) |
| 20. | Slovakia | 13.5 | 14.3 | 14.4 | 14.6 | 14.4 | 14.1 (8) |
| 21. | Brazil | 13.9 | 14.8 | 15.2 | 13.8 | 14.5 | 13.9 (27) |
| 22. | Mexico | 5.6 | 9.3 | 8.4 | 11.4 | 9.3 | 11.2 (26) |
| 23. | South Africa | 12.9 | 12.9 | 12.4 | 13.6 | 14.8 | 11.0 (23) |
| 24. | Romania | 10.7 | 10.8 | 10.6 | 10.7 | 10.8 | 10.7 (21) |
| 25. | Argentina | 6.7 | 5.9 | 5.9 | 5.7 | 5.3 | 6.5 (24) |
| 26. | Slovenia | 5.4 | 5.9 | 5.2 | 5.0 | 6.1 | 5.4 (7) |
| 27. | Japan | 280.3 | 156.2 | 17.2 | 13.9 | 0.0 | 4.3 (29) |
| 28. | Pakistan | 2.6 | 3.8 | 5.3 | 4.4 | 4.6 | 4.3 (31) |
| 29. | Netherlands | 3.8 | 3.9 | 3.7 | 2.7 | 3.9 | 3.9 (22) |
| 30. | Iran | 0.0 | 0.0 | 0.0 | 0.0 | 3.7 | 3.2 (28) |
| 31. | Armenia | 2.3 | 2.4 | 2.1 | 2.2 | 2.3 | 2.6 (20) |
| 32. | Lithuania | 0.0 | 0.0 | 0.0 | 0.0 | 0.0 | 0.0 (32) |
.
Data on national Nuclear Power generation: World Nuclear Association (links in the menu “Calculations”).
Diagram by Claus Andersen, 2016.
Comments are closed.