Methane, greenhouse effect and feedback loops
2014
Methane (CH4) is the third most prevalent greenhouse gas after carbon dioxide (CO2) and water vapor. Approximately one fifth of the anthropogenic greenhouse gas effect is caused by methane and slightly over half of the total methane emissions are due to human activity¹. The data of methane and carbon dioxide in the atmosphere since 1980 is available ‘here’. Since the 1800s, atmospheric methane concentrations have increased annually at a rate of about 0.9% (doubled in 200 years) and the present concentration has not been higher for over 800,000 years (see the atmospheric contrations ‘here‘). However, 3-4 billion years ago there was 1,000 times more methane in the atmosphere and oxygen did not become a major part of the atmosphere until photosynthetic organisms evolved later in the world’s history. The following gives a brief introduction to methane with emphasis on the interaction with carbon dioxide and the potential global warming feedback loops.
Climate change performance of Turkmenistan, Kazakhstan and Uzbekistan
2014
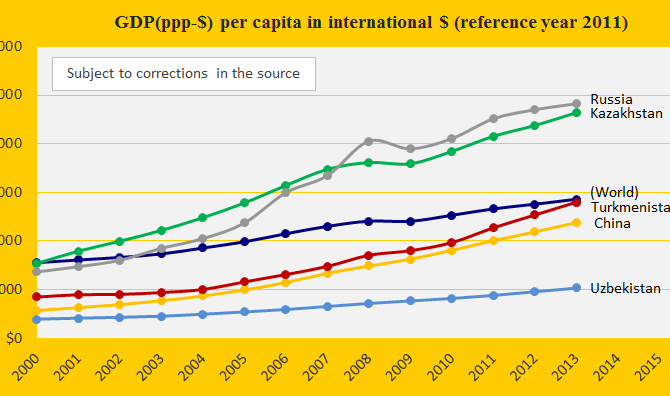
The three authoritarian regimes Turkmenistan, Kazakhstan and Uzbekistan were ranked respectively 31st, 40th and 71st on the worst performing list in ClimatePositions 2010. Their updated Climate Contributions (climate debt) are $1,043, $797 and $60 per capita. See the ranking ‘here’. The first diagram shows the GDP(ppp-$) per capita of the three neighboring countries located in the region Eurasia where the Middle East, Asia and Europe meet, in comparison with China, Russia and the world average.
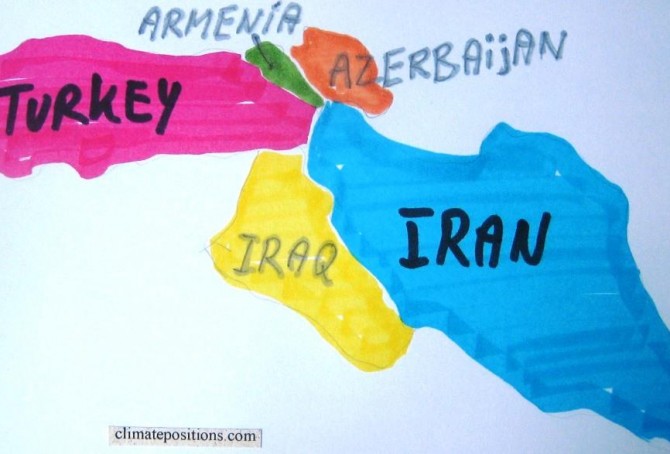
Climate change performance: Iran versus Turkey
2014
The CO2 Emissions of the authoritarian Islamic regime Iran have doubled from 4.0 tons per capita in the 1990s to 8.0 tons in 2011, while the Turkish emissions have increased from 2.5 tons in the 1990s to 3.8 tons in 2011. See the emissions since 2000 in the two diagrams below.

The Philippines beats Malaysia in climate change performance (what about the rainforests?)
2014
The Philippines is Contribution Free in ClimatePositions while Malaysia was the 36th worst performing country out of 145 in 2010. In 2014, the Malaysian Climate Contribution (climate debt) increased to $997 per capita and the present ranking is 31st (see ‘here’). The first diagram (below) illustrates the typical correlation between rapid economic growth and loss of sustainability that increases climate debt. The Malaysian climate debt, computed as a percentage of GDP(ppp-$) annually since 2000 increased from 0.38% in 2010 to 0.41% in 2014 (see the ranking ‘here’). This clearly demonstrates the lack of sustainable growth. The following examines the indicators of CO2 Emissions, Ecological Footprint, Forest Area and Marine Protection of the Philippines and Malaysia.