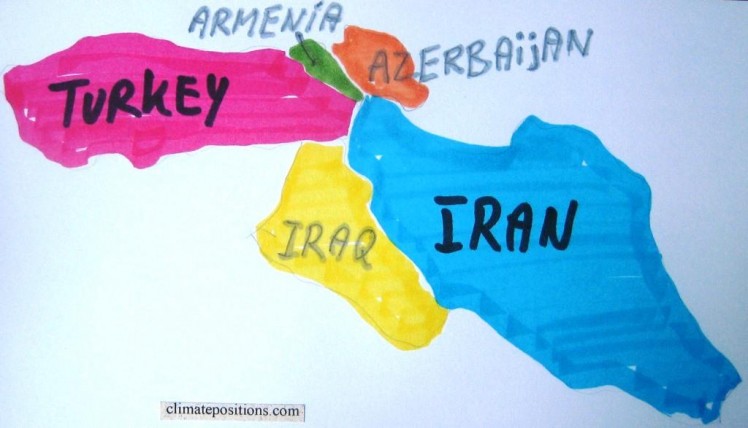
Climate change performance: Iran versus Turkey
2014
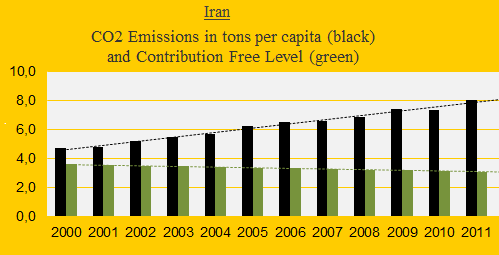
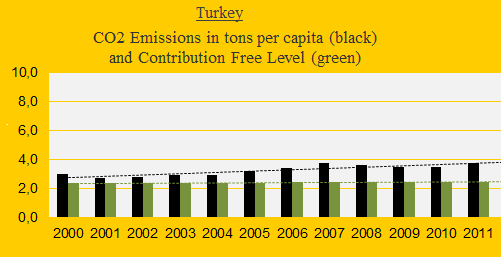
The CO2 Emissions of the authoritarian Islamic regime Iran have doubled from 4.0 tons per capita in the 1990s to 8.0 tons in 2011, while the Turkish emissions have increased from 2.5 tons in the 1990s to 3.8 tons in 2011. See the emissions since 2000 in the two diagrams below.
The green dashed line is the Contribution Free Level which is determined by the CO2 Emission Level in the 1990s and six updated indicator values (read more ‘here’). The distance between the dashed lines shows the excess CO2 and thus the climate debt calculation basis. Since 2010 the Iranian Climate Contribution (climate debt) has increased from $423 to $788 per capita and the Turkish debt has increased from $154 to $246. See the ranking ‘here’.
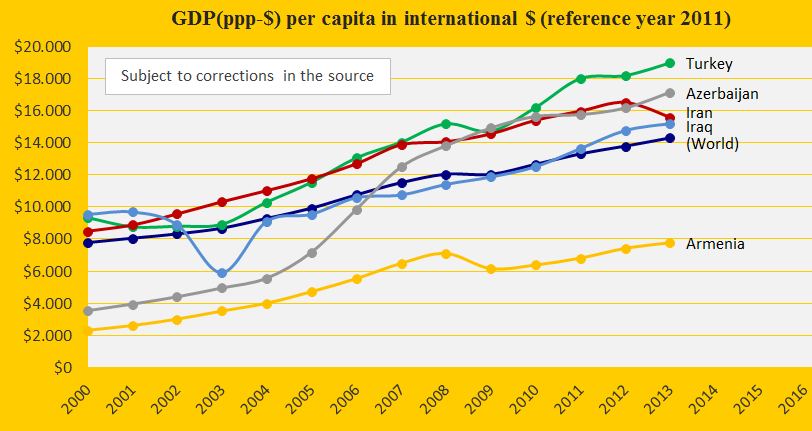
The next diagram shows the development in GDP(ppp-$) per capita for Iran, Turkey, Iraq, Armenia, Azerbaijan and the world average. Since 2009 the Turkish size of the GDP(ppp-$) has increased significantly compared to the Iranian – opposite the emitted CO2.
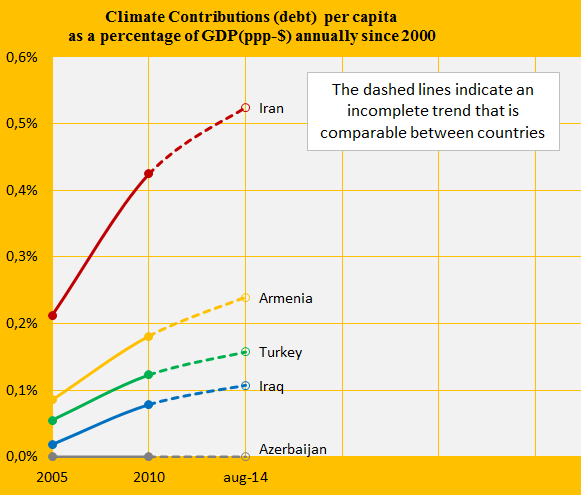
The last diagram shows the Climate Contributions since 2005 shown as a percentage of the national GDP(ppp-$) annually since 2000 for Iran, Turkey, Iraq, Armenia and Azerbaijan (Contribution Free). The dramatic Iranian increase illustrates the unusual combination of shrinking economy and growing CO2 Emissions. This could be a consequence of the UN-imposed ‘sanctions‘ (together with non-UN-mandated sanctions) since 2006 after Iran refused to suspend its uranium enrichment program. Note that Iran has the world’s largest proved gas reserves and ranks 4th in oil reserves.
The forest cover of Turkey increased from 12.6% of the land area in 1990 to 14.7% in 2010 – of which 8.6% (of the forest cover) is classified as primary forest, the most biodiverse form of forest¹. The coastal strip between the Black Sea and the Pontic Mountains contain some of the world’s few temperate rainforests (only 13% of the planet’s rainforests are temperate). The forest cover of Iran has remained at 6.8% since 1990.
¹According to ‘Wikipedia’ there are 40 national parks, 189 nature parks, 31 nature preserve areas and 80 wildlife protection areas in Turkey.
If Iran had remained at the CO2 Emission level of 4.0 tons per capita since the 1990s, and all the other indicators were unchanged, then the Climate Contribution (debt) would have been $189 per capita in 2014 instead of $788.
If Turkey had remained at the CO2 Emission level of 2.5 tons per capita since the 1990s, and all the other indicators were unchanged, then the Climate Contribution (debt) would have been $37 per capita in 2014 instead of $246.
Source on CO2 Emissions: EIA, U.S. Energy Information Administration (links in the menu “Calculations”).
Information on national GDP(ppp-$) per capita: Worldbank (links in the menu “Calculations”).
Sources on national forest area: United Nations (UN)(links in the menu “Calculations”) and ‘mongabay.com‘.
Drawing by Claus Andersen, 2014.
Comments are closed.