Carbon Brief: Global Carbon Budget and CO2 Emission scenarios (50% risk of 1.5C, 2.0C and 3.0C warming)
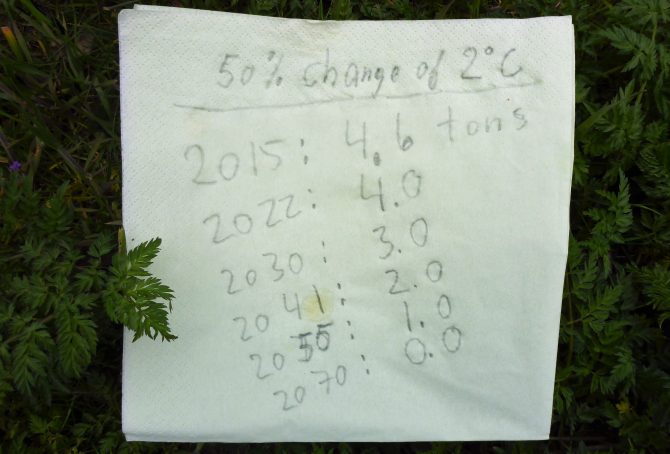
Based on IPCC’s recent synthesis report, published 2014, ‘Carbon Brief‘ has calculated the number of years we can continue with today’s emission level (and then stop emissions), and still keep global average temperature rise to no more than 1.5°C, 2°C or 3°C above pre-industrial levels – with a 33% risk, a 50% risk, and a 66% risk of failure. One out of nine figures suggest that five more years with the current level of CO2 Emissions (and then total stop) leaves us with a 33% risk of 1.5°C temperature rise.
To frame the overall situation, the first diagram (below) shows three key graphs 1960-2015, with 1960 set at 100: 1) Global CO2 Emissions¹ from Fossil Fuels (without bunker) and cement, 2) Global Population (with projections to 2100), and 3) CO2 Emissions per capita. Even significant reductions of per capita emissions¹, will not necessary compensate for the projected population growth.
Climate change performance: Egypt vs. Ukraine
Egypt and Ukraine are the world’s 25th and 26th largest emitters of CO2 from Fossil Fuels and cement. Combined, the two countries were responsible for 1.2% of global CO2 Emissions in 2015. The following examines the ‘Indicators‘ of CO2 Emissions, GDP(ppp-$), Ecological Footprint and the Ukrainian Nuclear Power.
The diagrams below show the per capita CO2 Emissions from Fossil Fuel (without bunkers) and cement, since 2000. The green bars show the Free Emission Level¹ – the exceedance is the basis for calculating the national Climate Debt.