Climate change performance of Ecuador, Bolivia, Colombia and Peru
2015
1.4% of the global population lives in Ecuador, Bolivia, Colombia or Peru, and together they emitted 0.6% of the global CO2 from fossil fuels in 2012. Ecuador’s updated Climate Debt per capita is $84 and Bolivia’s is $18. Colombia and Peru are both Contribution Free. See the ‘ranking’ by November 2014. The following examines the indicators of CO2 Emissions (carbon dioxide from fossil fuels), Forests and GDP(ppp-$).
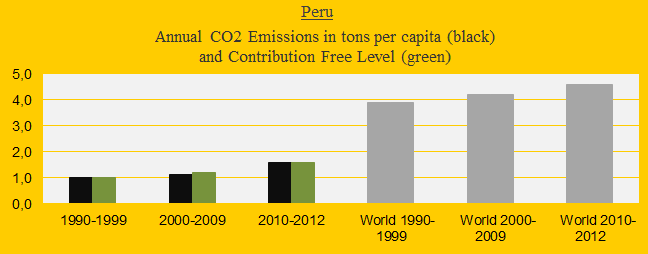
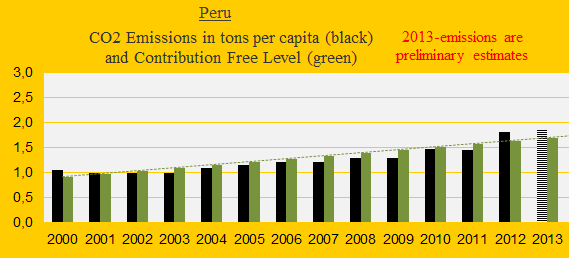
The four diagrams below show the CO2 Emissions per capita in decades of Ecuador, Bolivia, Colombia and Peru in comparison with the world average (the grey bars). The green bars show the Contribution Free Level in ClimatePositions – the free level is calculated on the basis of the level of CO2 Emissions in 1990s and a number of continuously updated ‘indicators’. If the black bars exceed the green, on average, then the country has a Climate Debt.
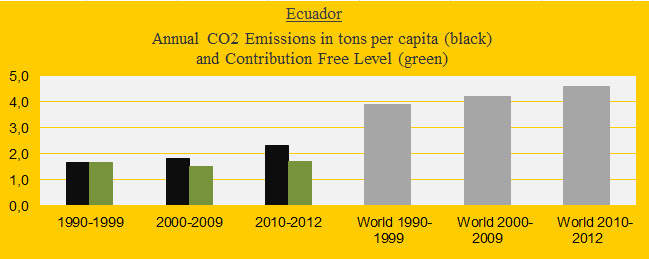
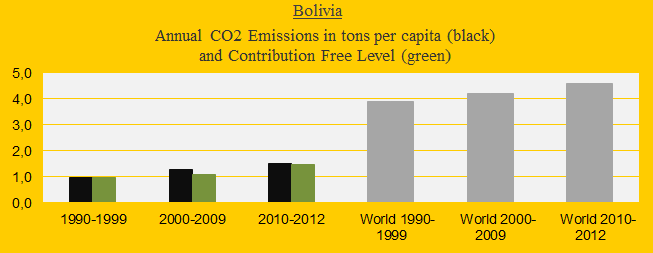
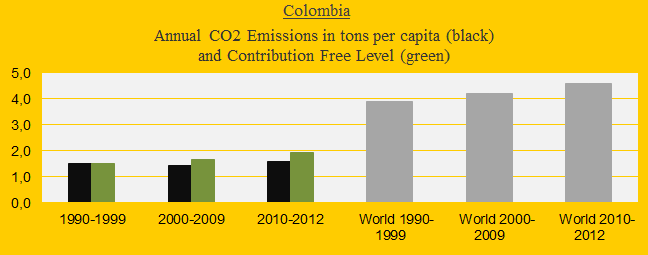
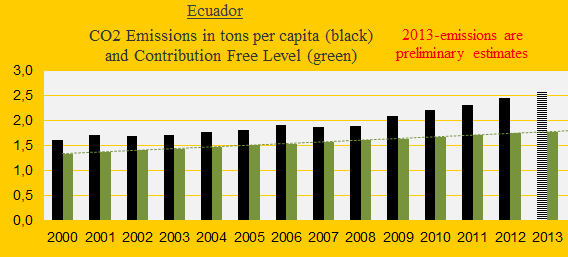
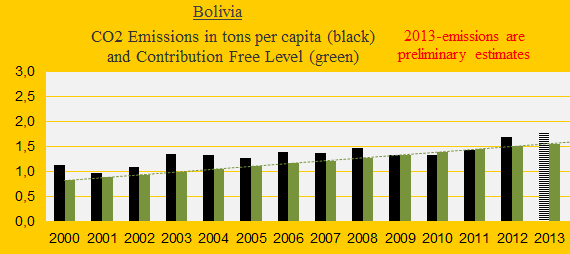
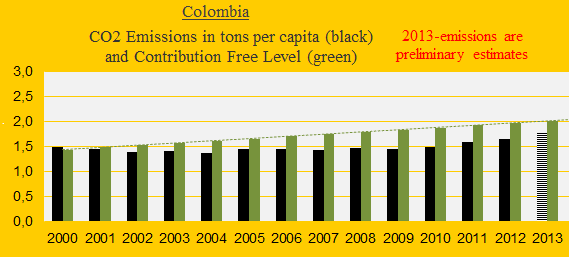
The next four diagrams show the CO2 Emissions per capita 2000-2013 (2013-emissions are preliminary estimates). All four countries may increase emissions moderately since the 1990s. Only Colombia is clearly below the Contribution Free Level.
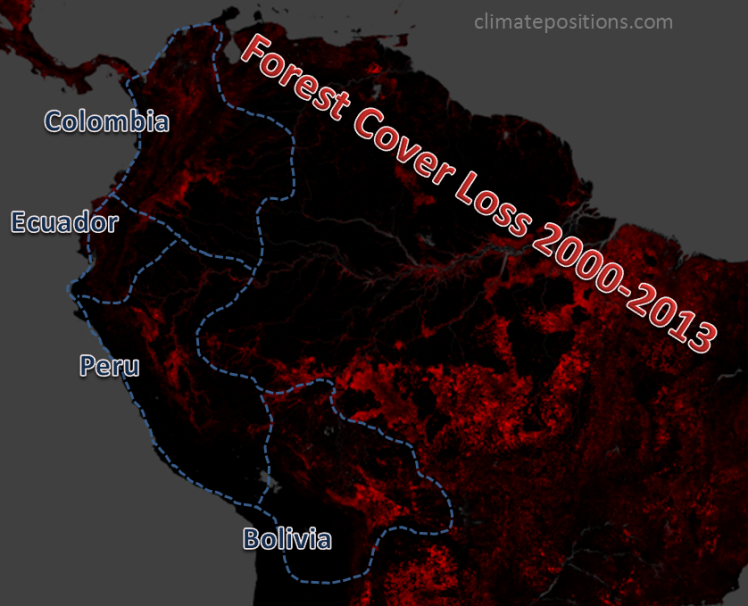
The table below shows the Forest Cover in 1990 and 2010 and Primary Forests in 2000 and 2010 (as percentages of the total land area). The overall trend is negative (only Ecuador’s Primary Forests has increased marginally). The cover-change of the two forest categories combined is included in the calculations of Climate Debts. The combined changes are: Ecuador (-13.9%), Bolivia (-6.9%), Colombia (-1.9%) and Peru (-3.3%). Read the hypothetical calculation examples at the bottom. Read also the article ‘Brazil’s rainforests and climate change performance‘ and details on the forests at mongabay.com: ‘Ecuador‘, ‘Bolivia‘, ‘Colombia‘ and ‘Peru‘.
| . | Forest Cover | Forest Cover | Primary Forests | Primary Forests |
| . | 1990 | 2010 | 2000 | 2010 |
| . | . | . | . | . |
| Ecuador | 49.9% | 35.6% | 16.5% | 17.0% |
| Bolivia | 57.9% | 52.7% | 35.5% | 33.8% |
| Colombia | 56.3% | 54.5% | 7.6% | 7.5% |
| Peru | 54.8% | 53.1% | 48.4% | 46.8% |
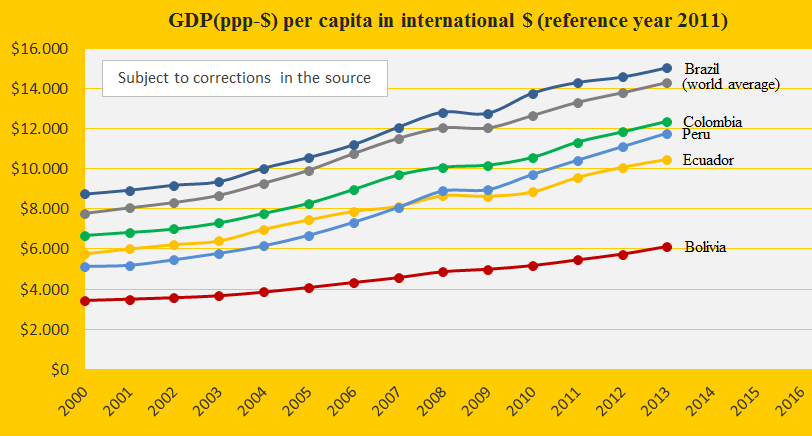
The GDP(ppp-$) per capita since 2000 of the same four countries, Brazil and the world average is shown in the diagram below. Bolivia is by far the poorest.
.
Four hypothetical examples: 1) If all Ecuador’s Forest Cover in 2010 were to be Primary Forests (more than a doubling of Primary Forests since 2000), then the current Climate Debt would decrease by 87%, 2) If Bolivia’s total Forest Cover in 1990 had been preserved then the Climate Debt would decrease by 70%, 3) If Colombia’s Forest Cover in 1990 had decreased by 30%, then the Climate Debt would be $11 per capita, and 4) If Peru’s Primary Forests had decreased by 10% since 2000 (instead of 1.6%), then the Climate Debt would be $3 per capita.
.
Information on national GDP(ppp-$) per capita: Worldbank (links in the menu “Calculations”).
Source on CO2 Emissions: EIA, U.S. Energy Information Administration and data on preliminary national CO2 Emissions are from Global Carbon Project (links in the menu “Calculations”).
Sources on national forest cover and primary forests: United Nations (UN) (links in the menu “Calculations”).
Map at the top with loss of forest cover (drawing etc. by Claus Andersen, 2015): ‘http://earthenginepartners.appspot.com/science-2013-global-forest‘.
Comments are closed.