Climate Debt: Norway ranks 9th (performance of top twenty from Human Development Index)

The so called ‘Human Development Index 2015’ (UN) ranks Norway 1st among 188 countries. The index is based on 1) Life expectancy at birth, 2) Expected years of schooling, 3) Mean years of schooling and 4) Gross national income (GNI) per capita. However, the wealthy Scandinavian oil state ‘Ranks‘ 9th among 148 countries on Climate Debt per capita. Norway is in other words a highly human developed demolisher of the climate, one might say! The following examines the climate performance of Norway in comparison with the other top five countries from Human Development Index: Australia, Switzerland, Denmark and Netherland.
To begin with, the table below shows some statistic of 20 out of 24 countries with the highest rank in Human Development Index (4 countries with lack of data in ClimatePositions are excluded from the table: Hong Kong (ranked 12), Liechtenstein (13), Iceland (16) and Luxembourg (19)). The table is read as follows: Norway ranks 1st at Human Development Index, the ‘per capita Climate Debt’ is $5,251 – the Norwegian share of the global population, CO2 Emissions from Fossil Fuels and cement, and Climate Debt is 0.07%, 0.13% and 0.47%, respectively – and finally the Climate Debt as share of national GDP ‘Ranks’ Norway 13th among 148 countries in ClimatePositions.
The share of the global population, CO2 Emissions and Climate Debt for 20-developed, as a group, is 12.51%, 29.40% and 59.26%, respectively. Being highly developed and at the same time letting down future generations, is somewhat contradictory!
| . | . | Climate Debt | Share of global | Share of global | Share of global | Climate Debt |
| . | . | per capita | population | CO2 Emissions | Climate Debt | Share of GDP |
| . | . | 2016 | 2014 | 2011 | 2016 | Rank |
| . | . | . | . | . | . | . |
| 1. | Norway | $5,251 | 0.07% | 0.13% | 0.47% | 13 |
| 2. | Australia | $5,635 | 0.34% | 1.07% | 2.33% | 8 |
| 3. | Switzerland | $650 | 0.12% | 0.11% | 0.09% | 66 |
| 4. | Denmark | $807 | 0.08% | 0.12% | 0.08% | 58 |
| 5. | Netherlands | $2,706 | 0.24% | 0.48% | 0.80% | 24 |
| 6. | Germany | $1.540 | 1.18% | 2.11% | 2.19% | 39 |
| 7. | Ireland | $2,718 | 0.07% | 0.10% | 0.22% | 25 |
| 8. | United States | $6,594 | 4.63% | 15.31% | 36.98% | 10 |
| 9. | Canada | $5,148 | 0.52% | 1.40% | 3.22% | 11 |
| 10. | New Zealand | $1,606 | 0.07% | 0.09% | 0.13% | 35 |
| 11. | Singapore | $0 | 0.08% | 0.06% | 0% | 86-148 |
| 14. | Sweden | $1,292 | 0.14% | 0.15% | 0.22% | 48 |
| 15. | United Kingdom | $1,068 | 0.94% | 1.29% | 1.21% | 51 |
| 17. | South Korea | $4.393 | 0.73% | 1.70% | 3.90% | 6 |
| 18. | Israel | $1,773 | 0.12% | 0.20% | 0.26% | 27 |
| 20. | Japan | $2,102 | 1.85% | 3.43% | 4.70% | 26 |
| 21. | Belgien | $2,460 | 0.16% | 0.28% | 0.49% | 22 |
| 22. | France | $1.148 | 0.96% | 0.98% | 1.34% | 47 |
| 23. | Austria | $2,305 | 0.12% | 0.19% | 0.35% | 31 |
| 24. | Finland | $3,048 | 0.08% | 0.16% | 0.29% | 19 |
| . | 20-developed | – | 12.51% | 29.4% | 59.26% | (34)¹ |
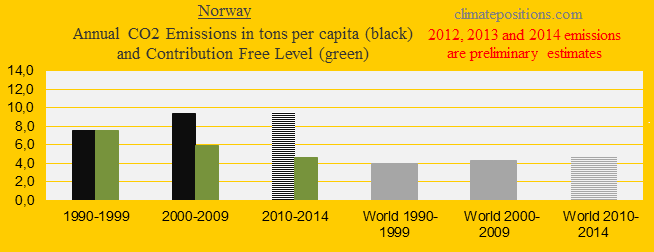
The first diagram shows Norway’s per capita CO2 Emissions from fossil fuels (without bunker fuels) and cement production in decades in comparison with the world average. CO2 Emissions since 2012 are preliminary estimates. From 7.6 tons in the 1990s the level increased to 9.5 tons on average between 2000 and 2014 (preliminary). The green bars are the Climate Debt Free Level in ClimatePositions, determined by the level of emissions in the 1990s and a number of continuously updated ‘Indicators’.
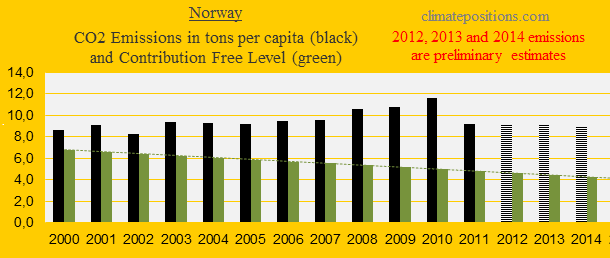
The diagram below shows the per capita CO2 Emissions from fossil fuels (without bunker fuels) and cement production since 2000. Emissions in 2012, 2013 and 2014 are preliminary estimates.
The Norwegian energy consumption is interesting: Among the 148 countries in ClimatePositions Norway ranks 8th on total energy consumption per capita (consuming 5.2 times the world average). However, 64.7% of the Norwegian energy consumption is renewable electricity, of which 98.6% is hydro- electricity. Although Norway is blessed with plenty of the convenient hydro- electricity the CO2 Emissions increased from 7.1 tons per capita in 1996 to 11.6 tons in 2010 (62% increase). The emission-level drop in 2011 is significant, though. According to ‘cownhall.com’, Norway’s GHG emissions rose by 1.5% in 2015, lifted by the oil and gas sector and industry.
The collapse in oil prices has slashed Norway’s revenues considerably and in May 2016, Norway issued new licenses for oil and gas exploration in fresh Arctic waters – the first new licenses since 1994. Petroleum and energy minister Lien said: “This will contribute to employment, growth and value creation in Norway. Northern Norway is now in the forefront of further developing the Norwegian petroleum industry.” According to environmental groups this could disrupt fragile Arctic ecosystems. Read the article: ‘Arctic oil drilling: outcry as Norway opens new areas to exploration’ (The Guardian).
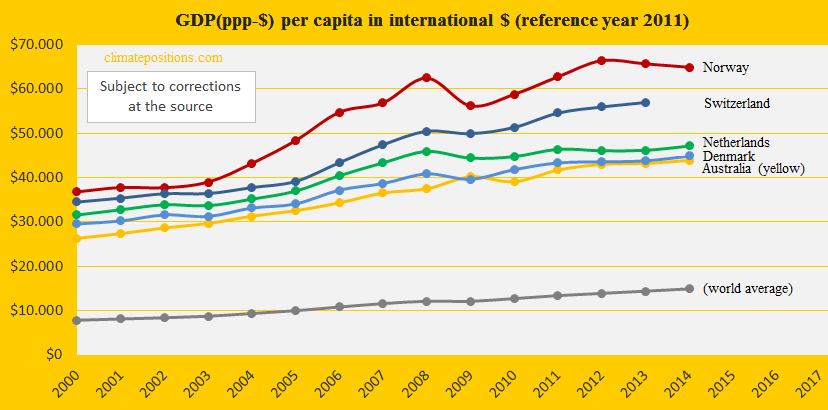
The diagram below shows the Norwegian development of GDP(ppp-$) since 2000, in comparison with the other top five countries from Human Development Index: Australia, Switzerland, Denmark and Netherland and the world average. Apparently, the fragile Artic ecosystems and the climate systems are being sacrificed due to Norway’s need for “growth and value creation”. Read also the ‘Article about Norway and the giant oil fund’.
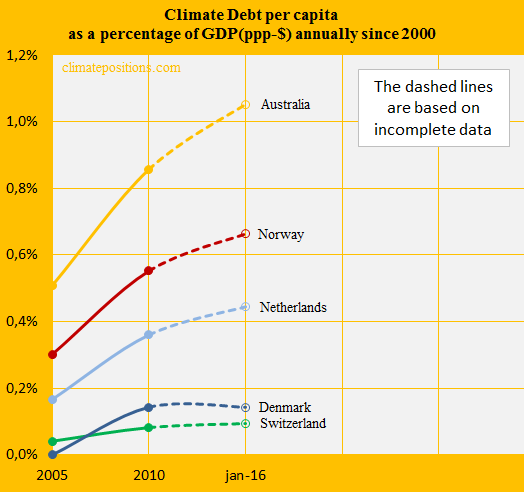
By January 2016 Norway’s Climate Debt as share of GDP(ppp-$), annually since 2000, was 0.66% and the ‘Ranking’ was 13th among 148 countries – in 2010 the ranking was 10th. The performance since 2005, along the same group of “highly developed” countries, is shown in the last diagram.
.
¹An average 20-developed country (small and large countries counts the same) ranks 34th among 148 countries in ClimatePositions.
.
Updated data and diagrams of all ‘Indicators‘ and all countries in ClimatePositions are available in the menu ‘Calculations (Excel)‘.
Human Development Index is from ‘Human Development Report’ by ‘United Nations Development Programme‘.
Data on carbon emissions (CO2 Emissions) from fossil fuels (without bunkers) and cement production are from Global Carbon Project (CDIAC); (links in the menu “Calculations”).
Information on national GDP(ppp-$) per capita: Worldbank (links in the menu “Calculations”).
PowerPoint collage is by Claus Andersen, 2016.
Comments are closed.