CO2 Emissions 2013: India is still Contribution Free (but how long?)
2014
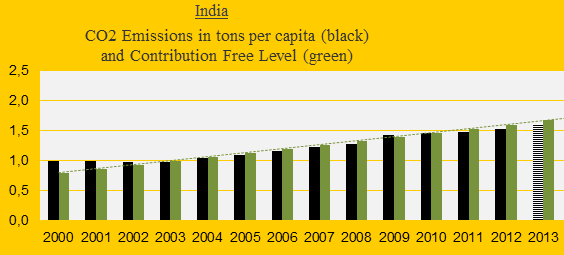
India was the 3rd largest emitter of carbon dioxide in 2013 (preliminary estimate), but the per capita emissions were only about one-third of the world average. The first diagram shows India’s CO2 Emissions per capita 2000-2013 (2013-emissions are preliminary estimates). The green bars are the Contribution Free Level in ClimatePositions. As long as emissions remain below the free level, on average, the climate debt is zero dollars. However, India balances close to the limit.
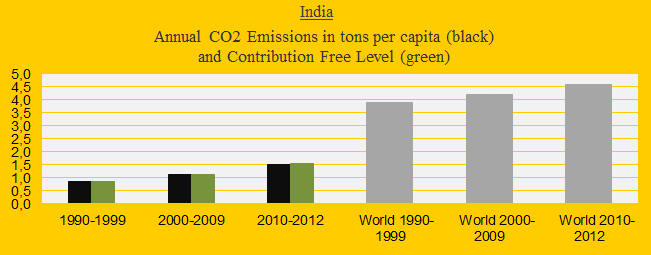
The diagram below shows the Indian CO2 Emissions per capita in decades in comparison with the world average (grey bars). The free level of CO2 Emissions (green bars) is defined by national emissions in the 1990s and a global future target¹.
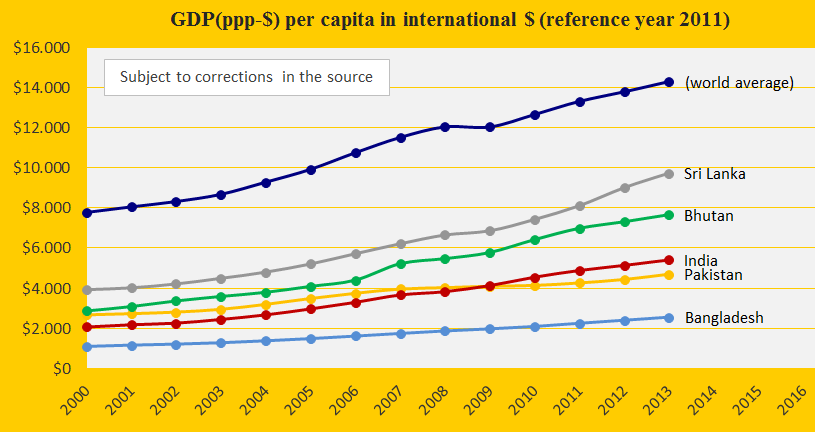
If India one day exceeds the Contribution Free Level of CO2 Emissions, the national wealth measured as GDP(ppp-$) will affect the size of the climate debt (a doubling of GDP(ppp-$) will double the climate debt). The diagram below shows India’s GDP(ppp-$) since 2000, in comparison with the world average and the neighboring countries Pakistan, Bangladesh, Bhutan and Sri Lanka (all are Contribution Free). Note that the latter two have faster growth rates than India, although they are also Contribution Free.
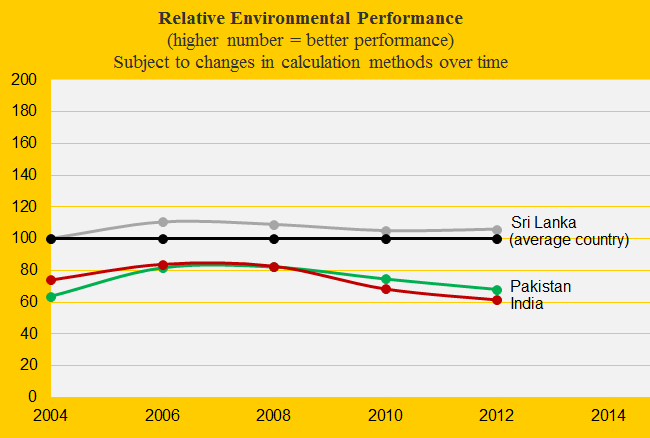
The environmental problems are severe in India and in the Environmental Performance Index the rank is 155 out of 178 countries (see more ‘details’). The diagram below shows the development in comparison with Pakistan and Sri Lanka.
The Indian Forest Cover has increased from 21.5% of the total area in 1990 to 23.0% in 2010 (see the diagram below). However, the extraordinary rich Primary Forests has remained at 4.8% of the total area (the red dot). Read about the challenges of forest protection in India in these articles: ‘1’ and ‘2’ (forests and environmental problems).

The population density is seven times higher in India than the world average and the growth rate 2000-2012 is slightly above the world average (see the diagram below). The number of Indians is growing more than twice as fast as the number of Chinese and it is expected that India will be the most populous nation by 2025. Without a significant reduction in population growth, environmental problems, climate change, CO2 Emissions and poverty issues will be difficult to address simultaneously. Read about planetary overpopulation in ‘Wikipedia’.

.
¹The current overall emission target in ClimatePositions is 2.8 tons per capita by 2024, with deductions due to updated national ‘indicators‘. In addition the growing global population and increasing atmospheric CO2-content automatically lowers the overall emission target. As an example one billion more people on the planet will lower the emission target to 2.4 tons per capita and 10% increase of atmospheric CO2 (from 396 to 436 ppm) will lower the target further to 2.2 tons.
With current trends, India will have a small climate debt very soon. A hypothetical example: If the Primary Forests in India were doubled by 2020, then the free level of CO2 Emissions from fossil fuels would increase by around 6%.
Information on national GDP(ppp-$) per capita: Worldbank (links in the menu “Calculations”).
Source on CO2 Emissions: EIA, U.S. Energy Information Administration (links in the menu “Calculations”).
Data on national and global Populations: EIA, U.S. Energy Information Administration (links in the menu “Calculations”).
Source on Environmental Performance: Yale and Columbia University reports, published 2006-2014 (links in the menu “Calculations”).
Comments are closed.