Giving up on future generations is real (about COP Submissions 2015)
2015
COP Submissions with intended national emission targets of 44 countries¹, responsible for 70% of the global CO2 Emissions from fossil fuels, are now available for study. Among the seven largest emitters only India’s submission is still missing. China, the world’s largest emitter, intends to reach its maximum emissions by 2030 (maybe earlier) and then reduce … which leaves global scenarios open to assumptions. The calculations in this article are based on 10% and 30% increase of the Chinese emissions by 2030, compared to 2013.
The calculation assumptions and methods are as follows:
- Emission targets of the greenhouse gases² described in the submissions are read as if they applies only for “CO2 Emissions from fossil fuels” (greenhouse gases from fossil fuels cover about 80% of the manmade global warming; read this ‘article’).
- Emission targets based on comparisons with “business as usual” are adapted to concrete 2030-targets by me (this covers only about 3% of global emissions).
- Emission targets by e.g. 2025, and other in-between targets, are adapted to concrete 2030-targets by me.
- China’s increase of emissions by 2030 is set at 10% or 30%, compared to 2013.
- Calculations of per capita CO2 Emissions are based on national population trends 2012-2013, projected to 2030.
The diagram below shows the global CO2 Emissions from fossil fuels in million tons and two estimated scenarios by 2030. The grey line is the global emissions, which basically is the worst case scenario from the IPCC Report 1990³. The black line is the emissions from the 44 countries which have submitted by now, covering 70% of global emissions. The stippled black lines are the intended emission targets by 2030, with either 10% or 30% increase of Chinese emissions by 2030, compared to 2013. Comments below the diagram.
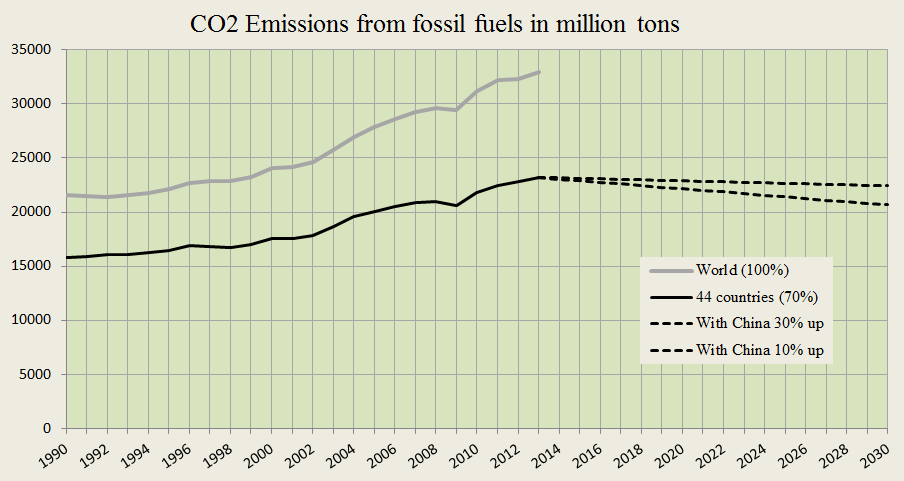
Back in 1990 the scientific recommendations were clear: significant reductions of greenhouse gases are necessary to avoid dangerous global warming … any postponement of the reductions is irresponsible because the reduction rate will have to be even steeper and therefore more costly. Since then, the level of global CO2 Emissions from fossil fuels has been 20% higher, on average 1991- 2013. If the latest COP submissions are effectuated (with the assumptions listed above) and if the same emission trend is assumed to cover the remaining countries, then the global level of CO2 Emissions from fossil fuels will end up 27-30% higher on average 1991-2030, than in 1990. Or in other words: The intended reduction rate from today will be so insignificant, that the annual emissions 2014-2030, will be 38-44% higher on average, than in 1990 (where significant reductions were necessary) … giving up on future generations is real and Climate Destruction will not go away.
The diagram below shows per capita CO2 Emissions from fossil fuels of the 44 countries (with 10% or 30% Chinese increase, by 2030), the United States, EU-28 and China (with 10% or 30% increase). The bars illustrate per capita CO2 Emissions in tons in 1990, 1991-2030 (average) and 2030. The average trend among the group of 44 countries is clear in boths scenarios: Per capita emissions will increase in comparison with 1990. More below the diagram.
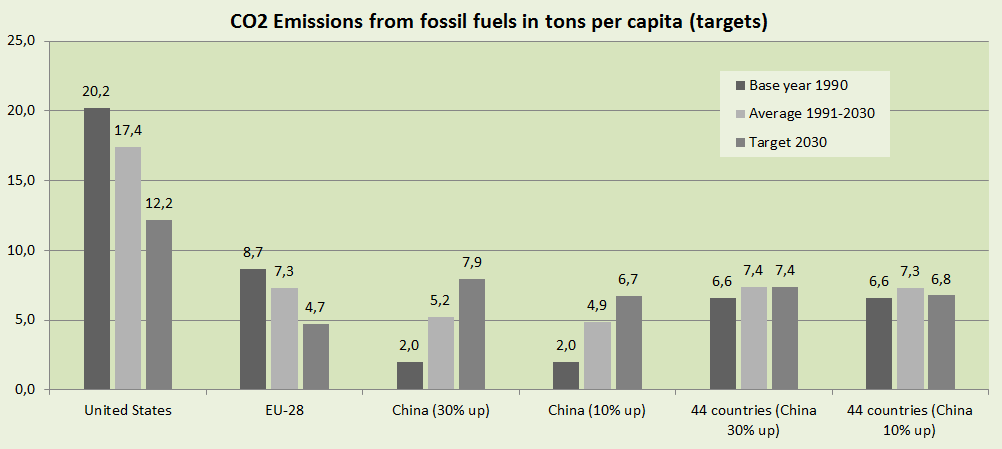
Imagine a fictive submission of the wealthy superpower United States back in 1990: “US intends to reduce CO2 Emissions from fossil fuels from 20.2 tons per capita in 1990 to 17.4 tons in 1991 (14% reduction) and keep this level over the next 40 years on average.” This will be the estimated climate impact of the historic emissions and the proclaimed 2015-intentions.
Imagine also a fictive submission of the poor China back in 1990: “With reference to the US submission China intends to increase CO2 Emissions from fossil fuels from 2.0 tons per capita in 1990 to 5.2 tons in 1991 and keep this level over the next 40 years on average.” This will be the estimated climate impact of the historic emissions and 30% increase by 2030, compared to 2013 (4.9 tons if the increase is 10%).
The United States and China combined were responsible for 39% of the world’s CO2 Emissions from fossil fuels between 1990 and 2013 (43% since 2010). Their combined share of the growing global Climate Debt in ClimatePositions was 47% in 2012 (see the ‘ranking’). The US share is down-going while the Chinese is up-going. Note that the dangerous warming effect of greenhouse gases has been known at least since the 1960s and that United States has emitted more than 19 tons of CO2 from fossil fuels per capita annually constantly between 1966 and 2008. According to the IPCC Report 2014, quote: “Many aspects of climate change and associated impacts will continue for centuries, even if anthropogenic emissions of greenhouse gases are stopped”, and: “Cumulative emissions of carbon dioxide largely determine global mean surface warming by the late 21st century and beyond”.
Both the United States and China have persistently rejected a globally binding climate agreement and the 2015-submissions with intended GHG-emission targets according to national circumstances, is the pitiful aftermath … with devastating consequences for future generations.
All these merits taken into account both China and especially the United States will be judged severely as the irreversible Climate Destruction proceeds.
¹The 44 countries: China, United States, European Union (EU-28: Belgium, Bulgaria, Croatia, Czech Republic, Denmark, Germany, Estonia, Ireland, Greece, Spain, France, Italy, Cyprus, Latvia, Lithuania, Luxembourg, Hungary, Malta, Netherlands, Austria, Poland, Portugal, Romania, Slovenia, Slovakia, Finland, Sweden, United Kingdom), Russia, Japan, Canada, Mexico, South Korea, Singapore, Serbia, Switzerland, Norway, New Zealand, Morocco, Gabon, Ethiopia and Iceland.
²The greenhouse gases: CO2 (Carbon dioxide), CH4 (Methane), N2O (Nitrous oxide), PFCs (Perfluorocarbons), HFCs (Hydrofluorocarbons), SF6 (Sulphur hexafluoride) and NF3 (Nitrogen trifluoride).
³The business-as-usual scenario (worst case) in the ‘IPCC Report 1990’ predicts a temperature rise of more than 3°C by 2100. Read this ‘article’.
.
Source on CO2 Emissions: EIA, U.S. Energy Information Administration and data on preliminary national CO2 Emissions are from Global Carbon Project (links in the menu “Calculations”).
COP Submissions 2015 (INDCs as communicated by Parties): ‘http://www4.unfccc.int/submissions/indc/Submission%20Pages/submissions.aspx‘
Data on national and global Populations: EIA, U.S. Energy Information Administration (links in the menu “Calculations”).
Haiku-inspired poem on top by Claus Andersen and L. Granerud, 2015.
Comments are closed.