Global ocean temperature January-April 2016 is scary news too (see the graph 1880-2016)
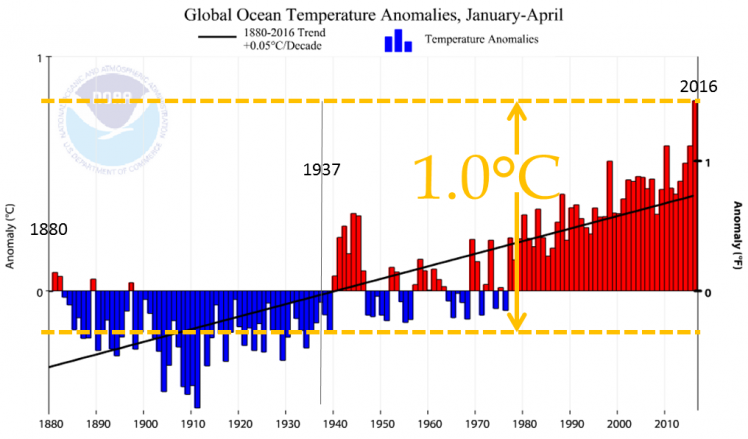
More than 90% of the additional heat trapped in the atmosphere due to human caused greenhouse gases such as carbon dioxide from burning of Fossil Fuels, is absorbed by the oceans. In continuation of the previous ‘Article’ the global ocean (air) temperature January-April 2016 was around 1.0ºC higher than the average temperature January-April between 1880 and 1937 (calculated by ClimatePositions) – see the graph. The black line shows the 136-year-trend. Compose your own graph at ‘http://www.ncdc.noaa.gov/cag/time-series/global’.Warmer oceans means increased intensity of storms and other extreme weather events, and numerous species are forced to leave their traditional waters. In addition, the increased level of CO2 in the atmosphere has made the oceans 30% more acidic, which harms creatures such as corals, mussels and oysters (Source: ‘The Guardian, January 2016’). Even the deep-water heat content has increased by several tenths of a degree since the industrial revolution according to a new ‘Study in Nature Climate Change’.
.
Background articles:
‘http://www.theguardian.com/environment/2016/jan/18/world-oceans-warming-faster-rate-new-study-fossil-fuels‘
‘http://www.theguardian.com/environment/2015/jul/16/warming-of-oceans-due-to-climate-change-is-unstoppable-say-us-scientists‘
‘http://ocean.nationalgeographic.com/ocean/explore/pristine-seas/critical-issues-sea-temperature-rise/‘
Data source on global Air Temperature (including the graph prior to the yellow additions and year-labels) is from: NOAA National Climatic Data Center (links in the menu “Calculations”).
Comments are closed.